Technical Analysis of EFAV 2024-05-10
Overview:
In analyzing the technical indicators for EFAV over the last 5 days, we will delve into the trend, momentum, volatility, and volume indicators to provide a comprehensive outlook on the possible stock price movement in the coming days.
Trend Analysis:
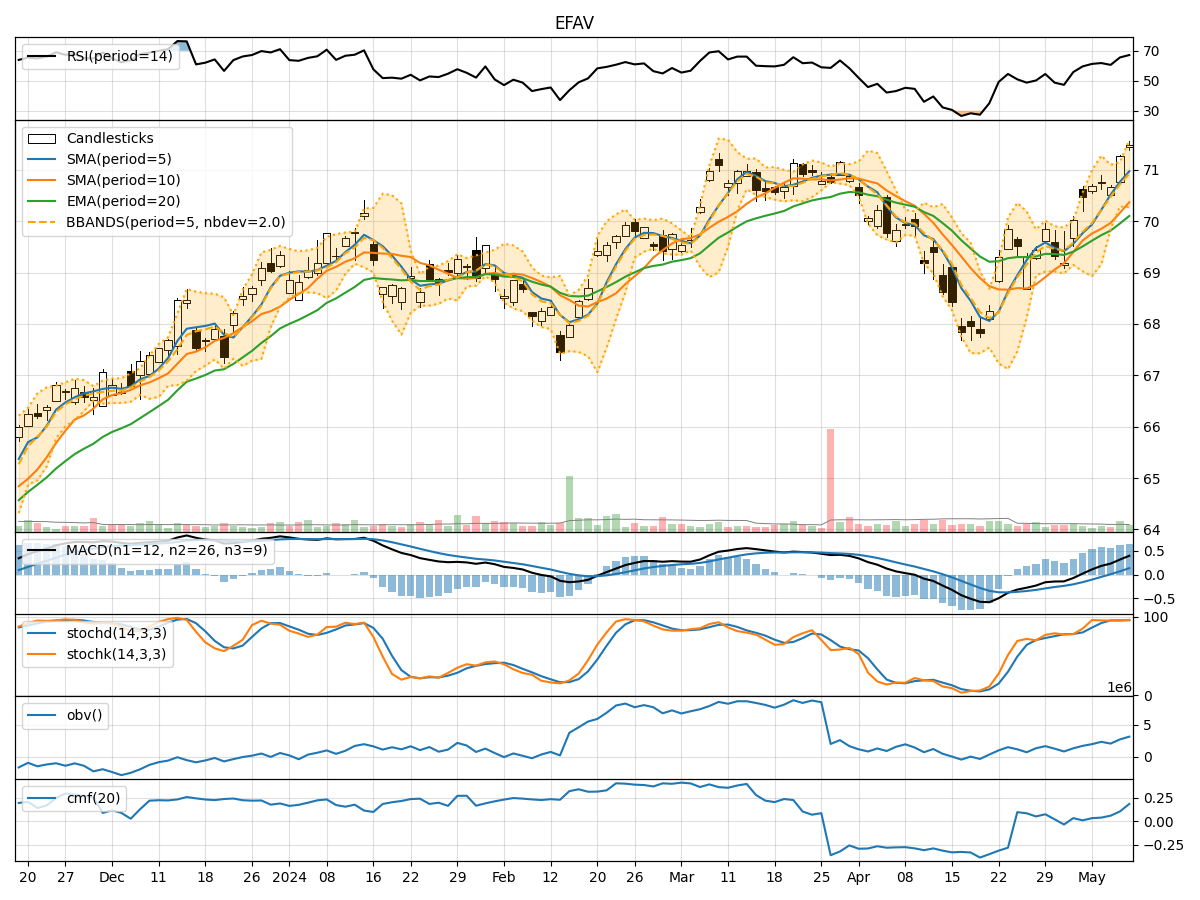
- Moving Averages (MA): The 5-day Moving Average has been consistently rising, indicating a bullish trend.
- MACD: The MACD line has been above the signal line for the past 5 days, suggesting a bullish momentum.
- RSI: The Relative Strength Index has been fluctuating but generally staying above 50, indicating bullish momentum.
Momentum Analysis:
- Stochastic Oscillator: Both %K and %D have been in the overbought zone, suggesting a potential reversal or consolidation.
- Williams %R: The Williams %R has been fluctuating but generally in the oversold territory, indicating a potential buying opportunity.
Volatility Analysis:
- Bollinger Bands: The stock price has been trading within the upper Bollinger Band, indicating an overbought condition.
- Average True Range (ATR): The ATR has been relatively stable, suggesting consistent price movements.
Volume Analysis:
- On-Balance Volume (OBV): The OBV has been increasing, indicating accumulation by investors.
- Chaikin Money Flow (CMF): The CMF has been positive, suggesting buying pressure in the stock.
Key Observations:
- The trend indicators suggest a strong bullish sentiment in the stock.
- Momentum indicators show signs of potential overbought conditions.
- Volatility indicators point towards a possible consolidation phase.
- Volume indicators indicate increasing buying interest in the stock.
Conclusion:
Based on the analysis of the technical indicators, the next few days' possible stock price movement for EFAV is likely to be sideways to slightly bearish. The stock has shown strong bullish momentum but is currently in overbought territory according to the momentum indicators. The volatility indicators suggest a potential consolidation phase, while the volume indicators indicate ongoing accumulation.
Recommendation: It is advisable to closely monitor the stock for signs of a potential pullback or consolidation before considering any new positions. Traders may look for entry points during dips or consolidation phases, while investors may consider booking profits if the stock continues to trade in overbought territory.