Technical Analysis of EFIV 2024-05-10
Overview:
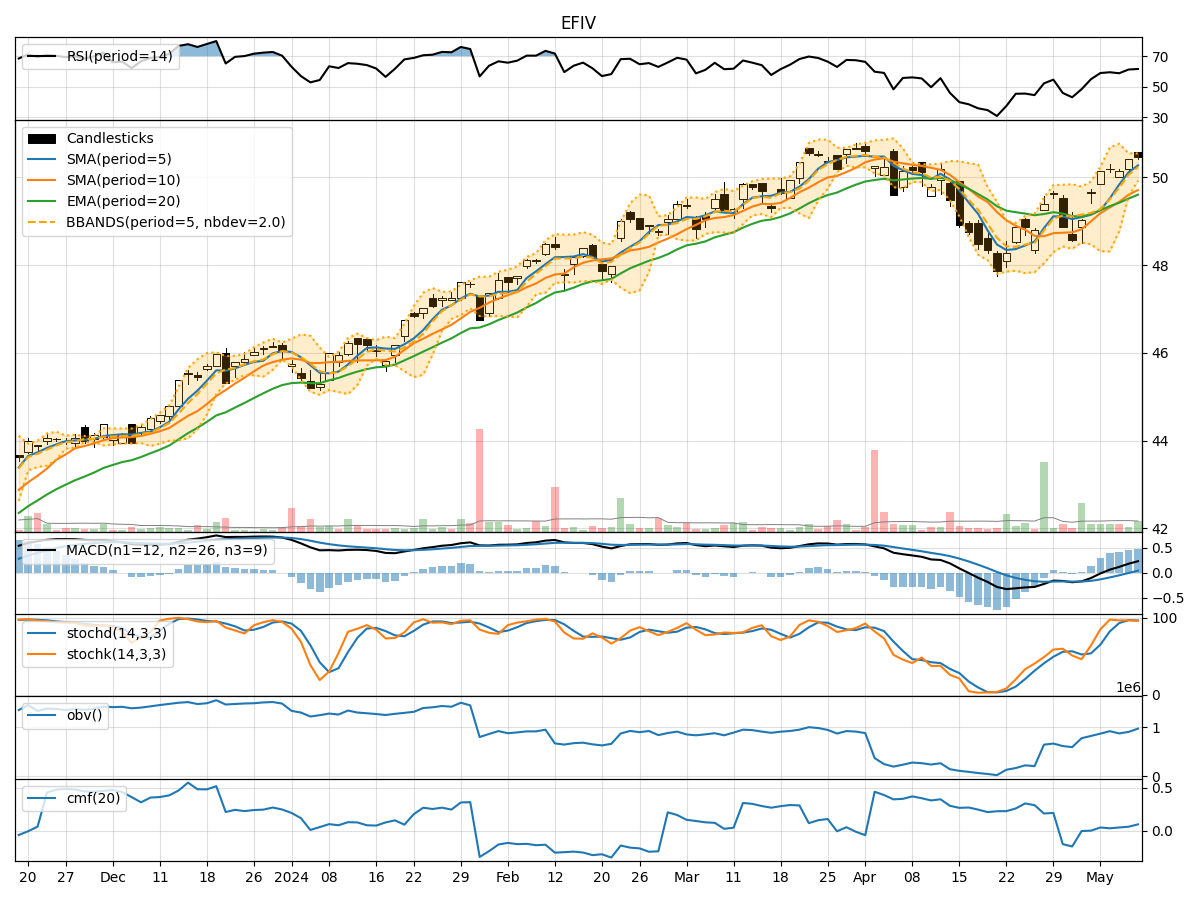
In analyzing the technical indicators for EFIV over the last 5 days, we will delve into the trend, momentum, volatility, and volume indicators to provide a comprehensive outlook on the possible stock price movement in the coming days.
Trend Indicators:
- Moving Averages (MA): The 5-day Moving Average has been consistently above the Simple Moving Average (SMA) and Exponential Moving Average (EMA), indicating a bullish trend.
- MACD: The MACD line has been consistently above the signal line, with both lines showing an upward trend, suggesting bullish momentum.
- MACD Histogram: The MACD Histogram has been increasing over the past 5 days, indicating strengthening bullish momentum.
Momentum Indicators:
- RSI: The Relative Strength Index (RSI) has been trending upwards and is currently in the overbought territory, suggesting a strong bullish momentum.
- Stochastic Oscillator: Both %K and %D lines of the Stochastic Oscillator have been in the overbought zone, indicating a strong bullish momentum.
- Williams %R: The Williams %R is also in the overbought region, further supporting the bullish sentiment.
Volatility Indicators:
- Bollinger Bands: The Bollinger Bands have been narrowing, indicating decreasing volatility in the stock price.
- Bollinger %B: The %B indicator has been increasing slightly, suggesting a potential uptrend in price movement.
Volume Indicators:
- On-Balance Volume (OBV): The OBV has been increasing over the last 5 days, indicating accumulation and supporting the bullish trend.
- Chaikin Money Flow (CMF): The CMF has been positive, indicating buying pressure in the stock.
Key Observations and Opinions:
- Trend: The trend indicators suggest a strong bullish sentiment in the stock.
- Momentum: Momentum indicators confirm the bullish trend with overbought conditions.
- Volatility: Volatility has been decreasing, potentially signaling a period of consolidation.
- Volume: Increasing OBV and positive CMF indicate strong buying interest in the stock.
Conclusion:
Based on the analysis of the technical indicators, the stock of EFIV is strongly bullish in the short term. The trend, momentum, and volume indicators all point towards further upside potential. However, considering the overbought conditions in the momentum indicators, a brief period of consolidation or a minor pullback may occur before the stock resumes its upward trajectory. Traders and investors should closely monitor the price action and key support levels for potential entry or exit points.