Technical Analysis of EFIX 2024-05-10
Overview:
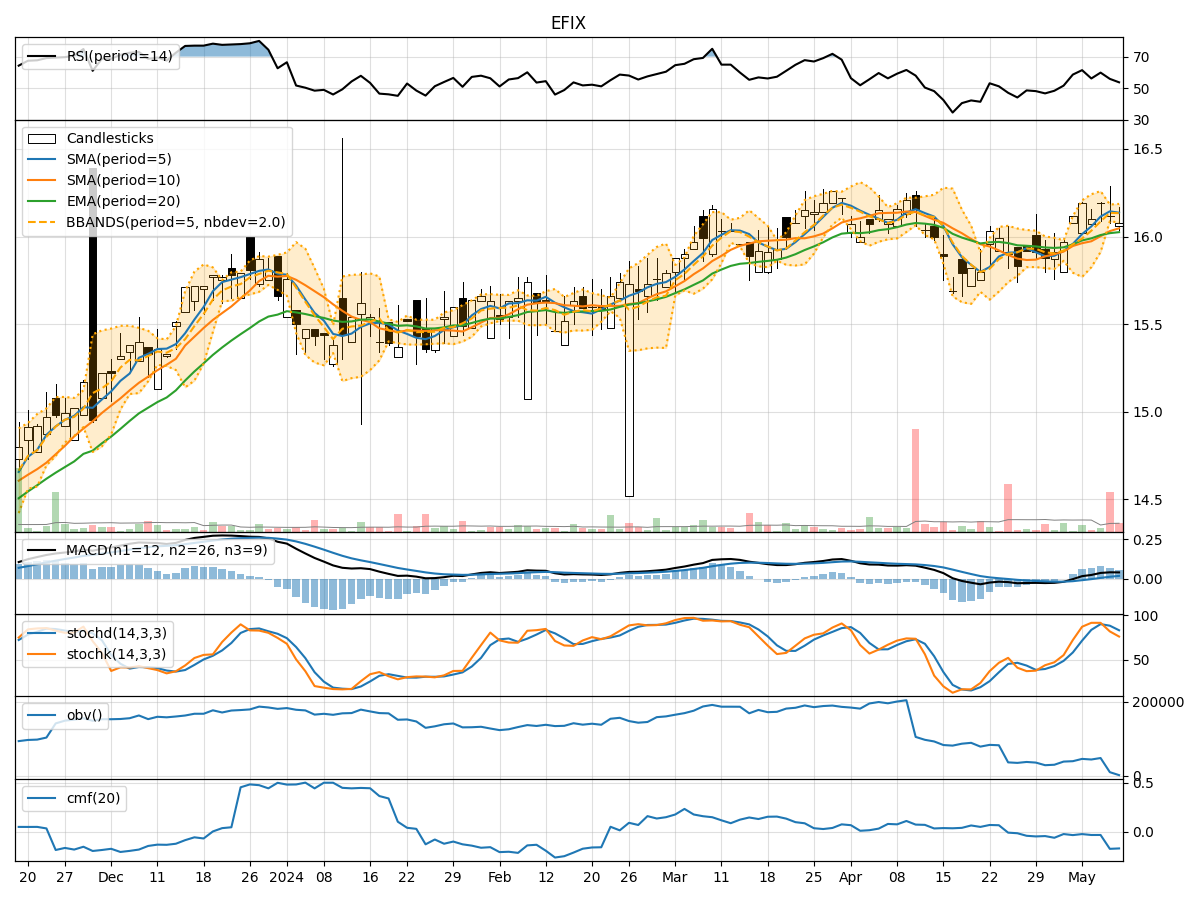
In analyzing the technical indicators for EFIX stock over the last 5 days, we will delve into the trend, momentum, volatility, and volume indicators to provide a comprehensive outlook on the possible stock price movement in the coming days. By examining these key indicators, we aim to offer valuable insights and predictions for potential investors.
Trend Indicators:
- Moving Averages (MA): The 5-day Moving Average (MA) has been consistently above the Simple Moving Average (SMA) and Exponential Moving Average (EMA), indicating a bullish trend.
- MACD: The MACD line has been consistently above the signal line, with both lines showing an upward trend, suggesting bullish momentum.
- Conclusion: The trend indicators point towards an upward movement in the stock price.
Momentum Indicators:
- RSI: The Relative Strength Index (RSI) has been fluctuating around the 50 level, indicating a neutral momentum.
- Stochastic Oscillator: Both %K and %D have been decreasing, signaling a potential reversal in momentum.
- Conclusion: The momentum indicators suggest a sideways movement or a possible correction in the stock price.
Volatility Indicators:
- Bollinger Bands: The stock price has been trading within the Bollinger Bands, with the bands narrowing, indicating decreasing volatility.
- Conclusion: Volatility is decreasing, suggesting a consolidation phase in the stock price.
Volume Indicators:
- On-Balance Volume (OBV): The OBV has been decreasing, indicating selling pressure in the stock.
- Chaikin Money Flow (CMF): The CMF has been negative, suggesting a lack of buying interest.
- Conclusion: The volume indicators point towards a bearish sentiment in the stock.
Overall Conclusion:
Based on the analysis of trend, momentum, volatility, and volume indicators, the next few days' possible stock price movement for EFIX is likely to be sideways to slightly bearish. While the trend indicators suggest an upward movement, the momentum indicators indicate a potential correction or sideways movement. The decreasing volatility and bearish volume indicators further support a cautious outlook.
Recommendation:
Investors should closely monitor the stock price for any signs of a reversal in momentum or a shift in trend. It is advisable to wait for more clarity in the market dynamics before making any significant investment decisions. Consider setting stop-loss orders to manage risk effectively in the current market environment.