Technical Analysis of EFNL 2024-05-10
Overview:
In analyzing the technical indicators for EFNL over the last 5 days, we will delve into the trend, momentum, volatility, and volume indicators to provide a comprehensive outlook on the possible stock price movement. By examining these key aspects, we aim to offer valuable insights and predictions for the upcoming days.
Trend Analysis:
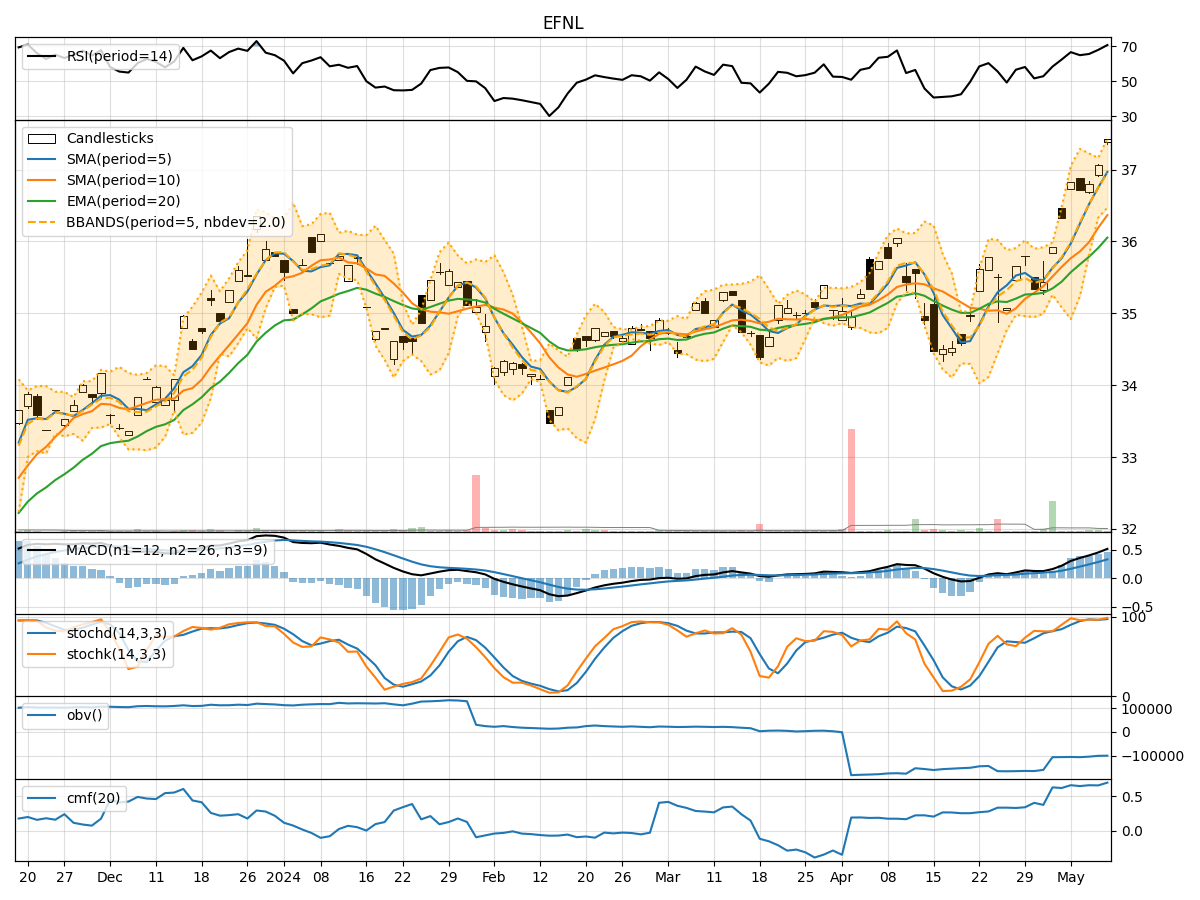
- Moving Averages (MA): The 5-day MA has been consistently rising, indicating a bullish trend in the short term.
- MACD: The MACD line has been above the signal line, suggesting positive momentum.
- EMA: The EMA has been trending upwards, supporting the bullish sentiment.
Key Observation: The trend indicators point towards an upward trend in the stock price.
Momentum Analysis:
- RSI: The RSI has been increasing, reaching overbought levels, indicating strong buying momentum.
- Stochastic Oscillator: Both %K and %D have been in the overbought zone, signaling potential price strength.
- Williams %R: The indicator has been hovering near oversold levels, suggesting a potential reversal.
Key Observation: Momentum indicators reflect a bullish sentiment with some signs of potential reversal.
Volatility Analysis:
- Bollinger Bands: The bands have been widening, indicating increased volatility in the stock price.
- Bollinger %B: The %B has been fluctuating within the bands, reflecting the volatility in price movements.
Key Observation: Volatility indicators suggest increased volatility in the stock price.
Volume Analysis:
- On-Balance Volume (OBV): The OBV has been fluctuating, indicating mixed buying and selling pressure.
- Chaikin Money Flow (CMF): The CMF has been positive, suggesting buying pressure in the stock.
Key Observation: Volume indicators show mixed signals with a slight bias towards buying pressure.
Conclusion:
Based on the analysis of the technical indicators, the overall outlook for EFNL in the next few days appears bullish. The trend indicators support an upward trajectory, while momentum indicators indicate strong buying momentum with potential for a reversal. Volatility is on the rise, suggesting increased price fluctuations, and volume indicators show a mix of buying and selling pressure.
Therefore, the next few days may see EFNL experiencing an upward movement with increased volatility. Traders should monitor the momentum closely for any signs of reversal, but the overall trend remains bullish.