Technical Analysis of EFO 2024-05-10
Overview:
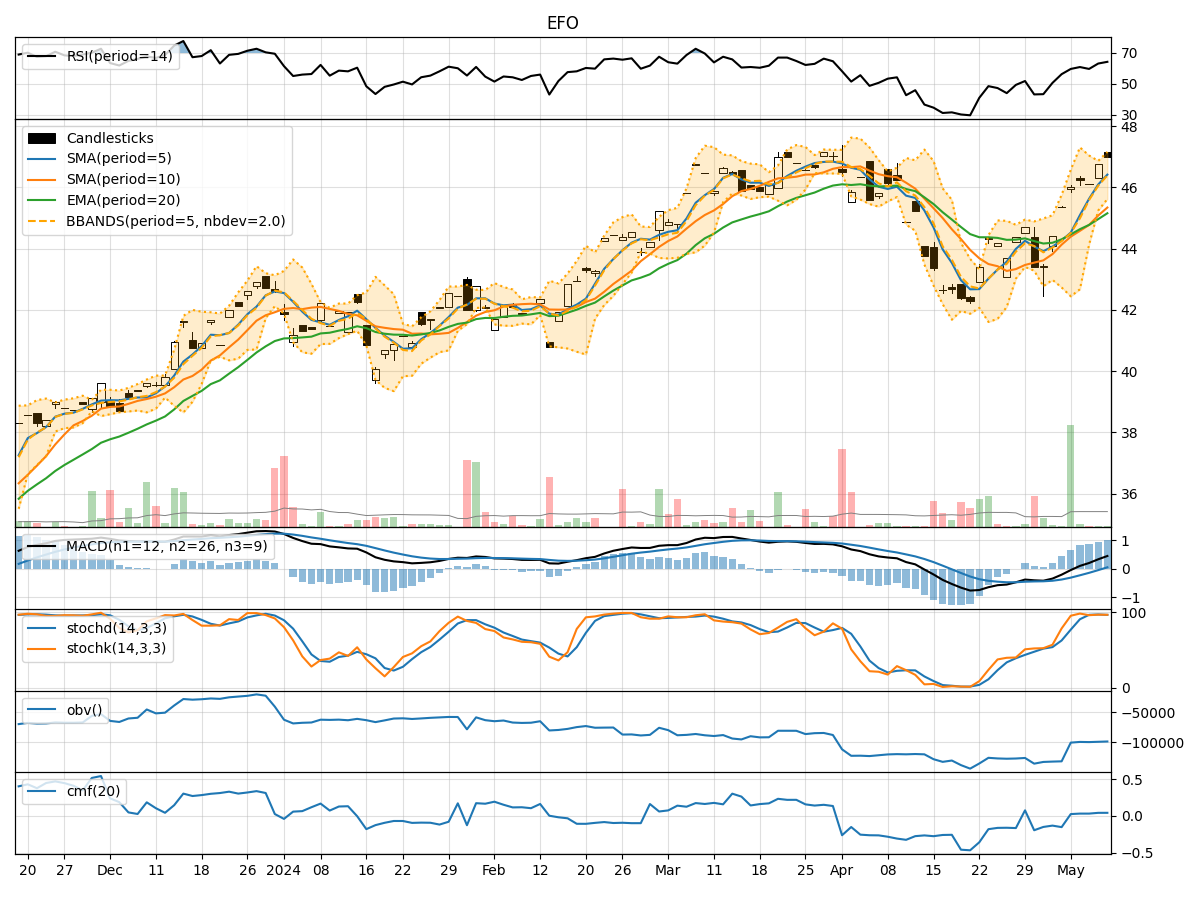
In analyzing the provided EFO TA data for the last 5 days, we will delve into the technical indicators across trend, momentum, volatility, and volume to forecast the possible stock price movement in the upcoming days. By examining these indicators comprehensively, we aim to provide a well-structured and insightful prediction for the future direction of the stock price.
Trend Analysis:
- Moving Averages (MA): The 5-day Moving Average (MA) has been consistently trending above the Simple Moving Average (SMA) and Exponential Moving Average (EMA) over the past 5 days, indicating a bullish trend.
- MACD: The Moving Average Convergence Divergence (MACD) has shown positive values with the MACD line consistently above the Signal line, suggesting bullish momentum in the stock price.
Momentum Analysis:
- RSI: The Relative Strength Index (RSI) has been hovering in the overbought territory, indicating strong buying momentum in the stock.
- Stochastic Oscillator: Both %K and %D lines of the Stochastic Oscillator have been in the overbought zone, signaling a potential reversal or consolidation phase.
Volatility Analysis:
- Bollinger Bands (BB): The stock price has been trading within the upper Bollinger Band (BBU) range, suggesting an increased level of volatility and a possible continuation of the uptrend.
Volume Analysis:
- On-Balance Volume (OBV): The OBV indicator has been showing a decreasing trend, indicating a divergence between price and volume, which could signal a potential reversal.
- Chaikin Money Flow (CMF): The CMF has been positive, reflecting buying pressure in the stock over the past 20 days.
Key Observations:
- The stock is currently in a strong uptrend based on moving averages and MACD.
- Momentum indicators suggest overbought conditions, potentially leading to a short-term correction or consolidation.
- Volatility has increased, indicating potential price swings in the near future.
- Volume indicators show a divergence, which could imply a shift in market sentiment.
Conclusion:
Based on the analysis of the technical indicators, the next few days' possible stock price movement could see a short-term correction or consolidation due to the overbought conditions indicated by momentum indicators. However, the overall trend remains bullish based on moving averages and MACD. Traders should be cautious of potential volatility and monitor volume trends for confirmation of the price direction. It is advisable to consider taking profits or implementing risk management strategies in anticipation of a potential pullback before considering further long positions.