Technical Analysis of EFRA 2024-05-10
Overview:
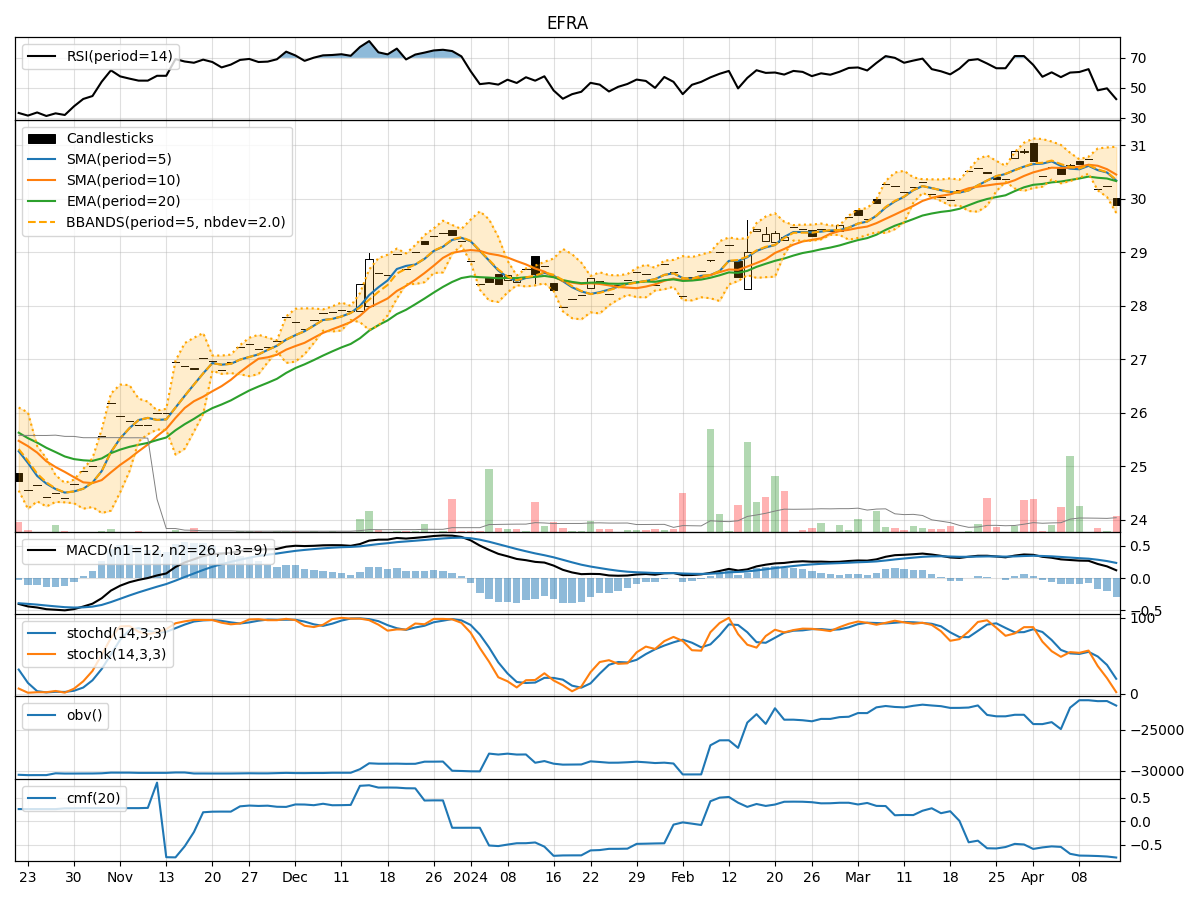
In analyzing the technical indicators for EFRA stock over the last 5 days, we will delve into the trends, momentum, volatility, and volume aspects to provide a comprehensive outlook on the possible stock price movement in the coming days. By examining key indicators such as moving averages, MACD, RSI, Bollinger Bands, and OBV, we aim to offer valuable insights and predictions for potential price action.
Trend Analysis:
- Moving Averages (MA): The 5-day MA has been consistently above the 10-day SMA, indicating a short-term bullish trend.
- MACD: The MACD line has been above the signal line, with both lines showing an upward trend, suggesting bullish momentum.
Momentum Analysis:
- RSI: The RSI has been consistently above 70, indicating overbought conditions but also strong bullish momentum.
- Stochastic Oscillator: Both %K and %D have been at 100, signaling strong upward momentum.
Volatility Analysis:
- Bollinger Bands (BB): The stock price has been trading close to the upper Bollinger Band, suggesting high volatility and potential overbought conditions.
Volume Analysis:
- On-Balance Volume (OBV): The OBV has been increasing over the last 5 days, indicating accumulation by investors.
Key Observations:
- The stock is in a strong bullish trend based on moving averages and MACD.
- Momentum indicators like RSI and Stochastic Oscillator signal overbought conditions but strong upward momentum.
- High volatility as indicated by the Bollinger Bands suggests potential for a pullback.
- Increasing OBV reflects positive volume accumulation and investor interest.
Conclusion:
Based on the analysis of technical indicators, the next few days for EFRA stock are likely to see continued upward movement in price. The strong bullish trend, supported by momentum indicators and increasing volume accumulation, indicates a favorable outlook for the stock. However, caution is advised due to the overbought conditions highlighted by RSI and Stochastic Oscillator, which could lead to a potential pullback or consolidation in the short term. Traders and investors should closely monitor price action and key levels to capitalize on potential opportunities while managing risks effectively.