Technical Analysis of EFU 2024-05-10
Overview:
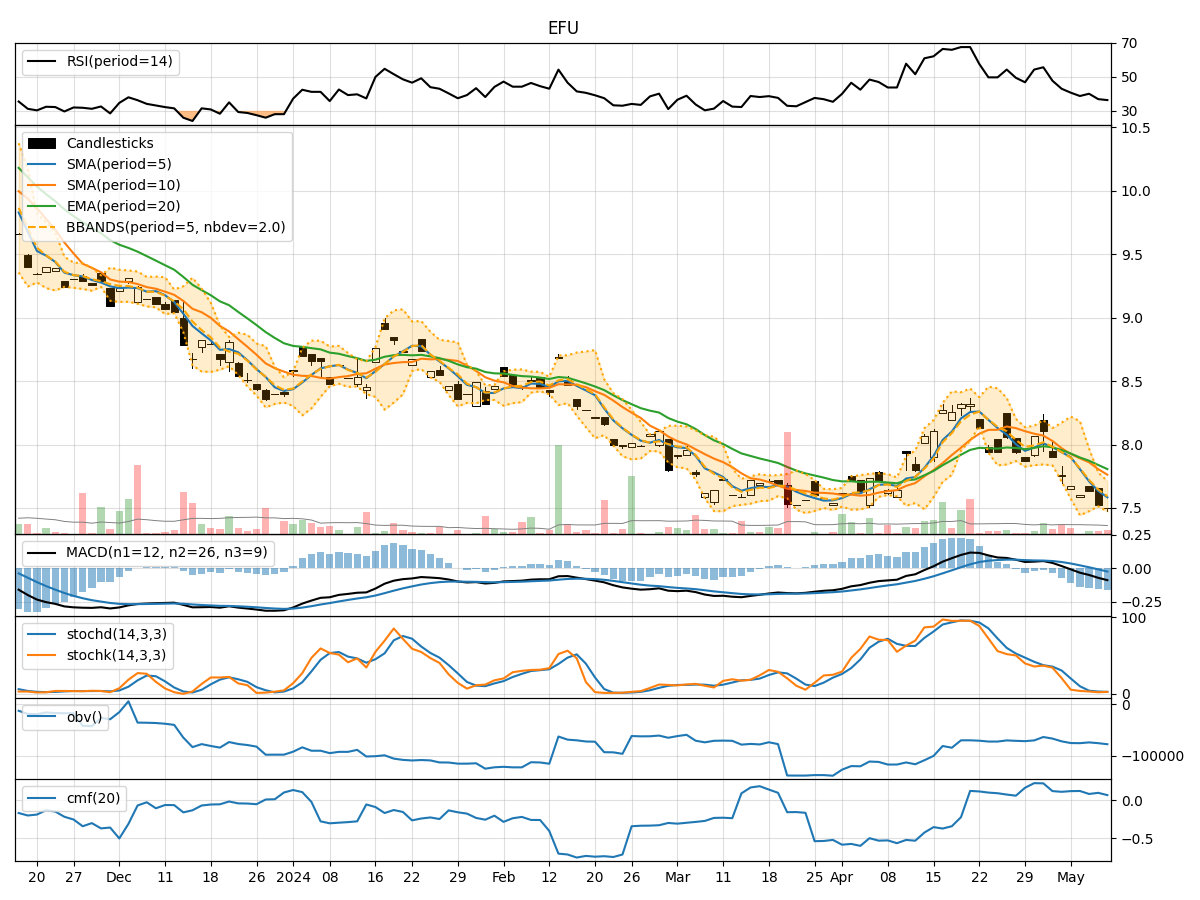
In analyzing the technical indicators for EFU stock over the last 5 days, we will delve into the trends, momentum, volatility, and volume indicators to provide a comprehensive outlook on the possible stock price movement in the coming days. By examining these key indicators, we aim to offer valuable insights and predictions for potential investors.
Trend Analysis:
- Moving Averages (MA): The 5-day moving average has been consistently decreasing, indicating a downward trend in the stock price.
- MACD: The MACD line has been negative and decreasing, suggesting a bearish momentum in the stock.
- EMA: The exponential moving average has also been declining, reinforcing the bearish sentiment in the stock.
Momentum Analysis:
- RSI: The Relative Strength Index has been decreasing and is currently in the oversold territory, signaling a potential reversal or continuation of the downtrend.
- Stochastic Oscillator: Both %K and %D have been decreasing, indicating a bearish momentum in the stock.
- Williams %R: The Williams %R is in the oversold region, suggesting a potential buying opportunity or further downside movement.
Volatility Analysis:
- Bollinger Bands: The stock price has been trading below the lower Bollinger Band, indicating oversold conditions and a potential reversal or bounce back.
- Bollinger %B: The %B indicator is below 0.2, signaling a possible oversold condition and a potential buying opportunity.
Volume Analysis:
- On-Balance Volume (OBV): The OBV has been fluctuating but has not shown a clear trend, indicating mixed sentiment among investors.
- Chaikin Money Flow (CMF): The CMF has been positive but decreasing, suggesting a potential outflow of money from the stock.
Conclusion:
Based on the analysis of the technical indicators, the stock is currently in a downtrend with bearish momentum and oversold conditions. However, the stock is also approaching key support levels, which could lead to a potential reversal or consolidation in the coming days. Investors should closely monitor the price action and key support levels for any signs of a trend reversal or continuation of the downtrend. Exercise caution and consider waiting for confirmation signals before making any trading decisions.