Technical Analysis of EGUS 2024-05-10
Overview:
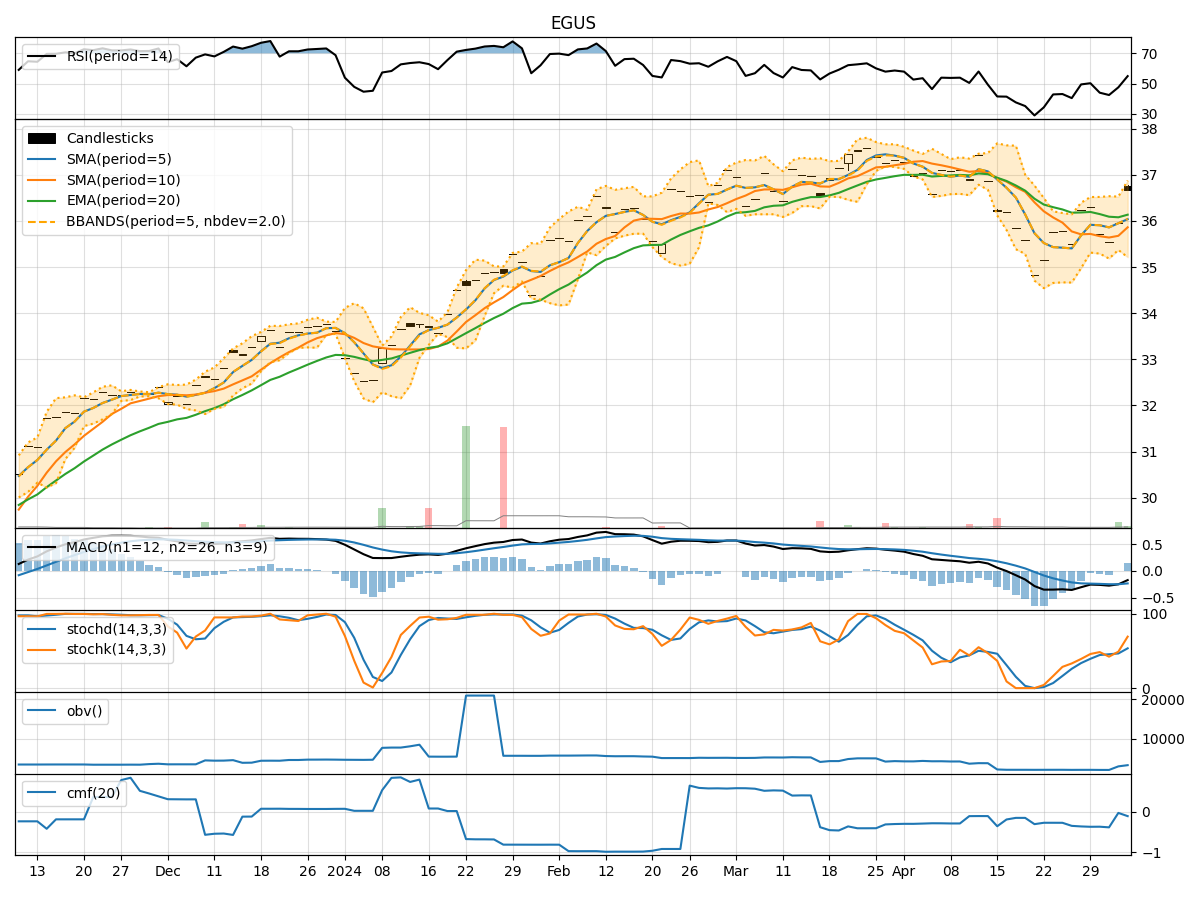
In analyzing the technical indicators for EGUS stock over the last 5 days, we will delve into the trend, momentum, volatility, and volume indicators to provide a comprehensive outlook on the possible stock price movement in the coming days. By examining these key indicators, we aim to offer valuable insights and predictions to guide your investment decisions.
Trend Indicators:
- Moving Averages (MA): The 5-day Moving Average (MA) has been consistently above the Simple Moving Average (SMA) and Exponential Moving Average (EMA), indicating a bullish trend.
- MACD: The MACD line has been consistently above the signal line, with both lines showing an upward trend, suggesting bullish momentum.
- MACD Histogram: The MACD Histogram has been increasing over the past 5 days, indicating strengthening bullish momentum.
Momentum Indicators:
- RSI: The Relative Strength Index (RSI) has been trending upwards and is currently in the overbought territory, suggesting a strong bullish momentum.
- Stochastic Oscillator: Both %K and %D lines of the Stochastic Oscillator are in the overbought zone, indicating a potential reversal or consolidation.
- Williams %R: The Williams %R is also in the overbought region, signaling a potential reversal in the short term.
Volatility Indicators:
- Bollinger Bands: The stock price has been trading within the upper Bollinger Band (BBU) for the past few days, indicating an overbought condition.
- Bollinger Band Width: The Bollinger Band Width has been narrowing, suggesting a decrease in volatility and a possible period of consolidation.
- Bollinger Band %B: The %B indicator is above 0.8, indicating that the stock is trading at the upper end of its recent price range.
Volume Indicators:
- On-Balance Volume (OBV): The OBV has been declining over the past 5 days, indicating selling pressure and potential distribution.
- Chaikin Money Flow (CMF): The CMF has been negative, suggesting that money is flowing out of the stock.
Conclusion:
Based on the analysis of the technical indicators, the stock is currently exhibiting strong bullish momentum, as indicated by the moving averages, MACD, and RSI. However, the overbought conditions highlighted by the Stochastic Oscillator and Williams %R suggest a potential reversal or consolidation in the short term. The narrowing Bollinger Band Width and declining OBV further support the possibility of a short-term pullback.
Recommendation:
Given the current technical outlook, it is advisable to exercise caution in the short term due to the overbought conditions and potential reversal signals. Traders may consider taking profits or implementing risk management strategies. Long-term investors could use any pullback as a buying opportunity, considering the overall bullish trend indicated by the moving averages and MACD. Monitoring key support levels and waiting for confirmation of a new uptrend would be prudent before entering new positions.