Technical Analysis of EIRL 2024-05-10
Overview:
In analyzing the technical indicators for EIRL over the last 5 days, we will delve into the trend, momentum, volatility, and volume indicators to provide a comprehensive outlook on the possible stock price movement in the coming days. By examining these key indicators, we aim to offer valuable insights and predictions to guide your investment decisions.
Trend Analysis:
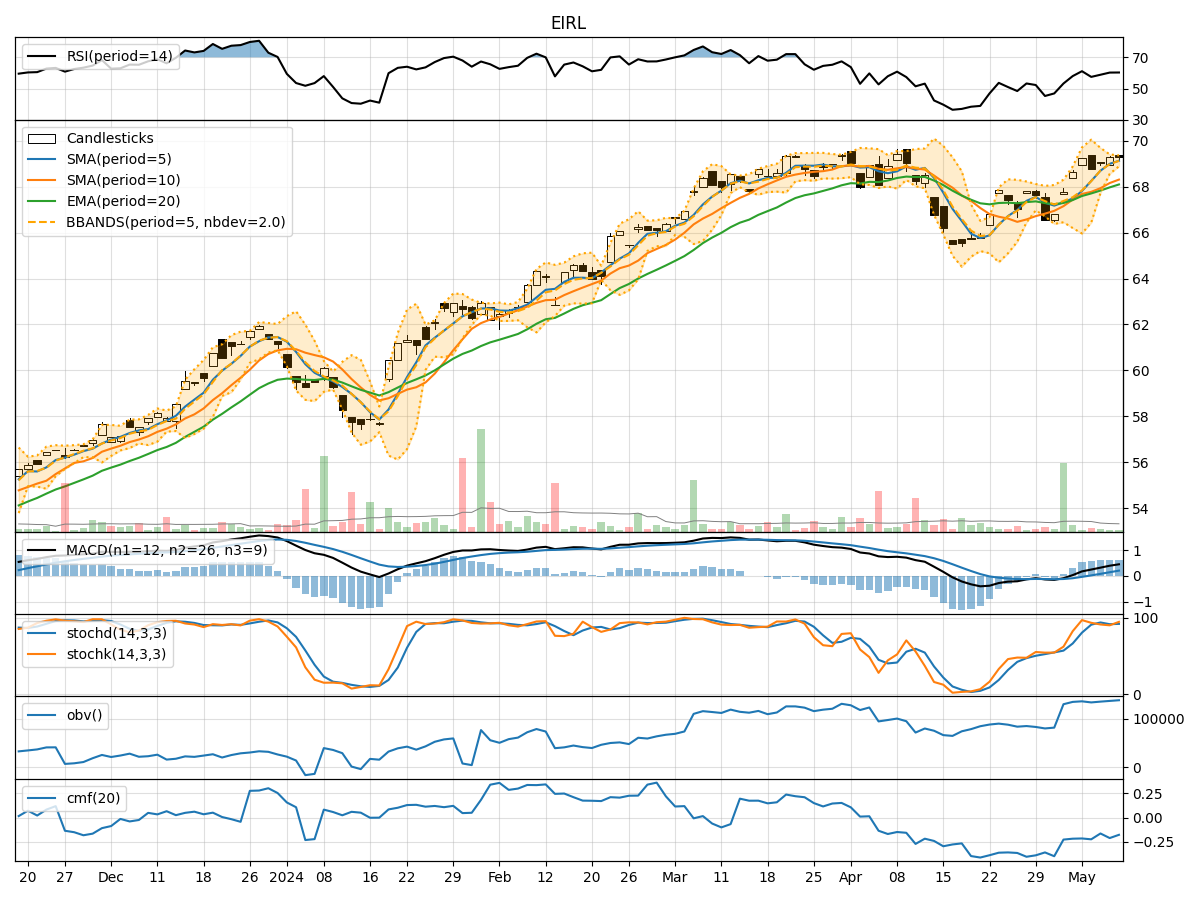
- Moving Averages (MA): The 5-day Moving Average (MA) has been consistently above the Simple Moving Average (SMA) and Exponential Moving Average (EMA), indicating a bullish trend.
- MACD: The MACD line has been consistently above the signal line, with both lines showing an upward trend, suggesting bullish momentum.
- Conclusion: The trend indicators point towards an upward trend in the stock price.
Momentum Analysis:
- RSI: The Relative Strength Index (RSI) has been gradually increasing but remains below the overbought threshold of 70, indicating potential room for further upside.
- Stochastic Oscillator: Both %K and %D lines of the Stochastic Oscillator have been fluctuating but are currently in the overbought zone, suggesting a possible reversal.
- Conclusion: Momentum indicators suggest a mixed outlook with a potential for a short-term correction.
Volatility Analysis:
- Bollinger Bands: The stock price has been trading within the Bollinger Bands, with the bands narrowing, indicating decreasing volatility.
- Conclusion: Volatility indicators signal a consolidation phase with a potential breakout in either direction.
Volume Analysis:
- On-Balance Volume (OBV): The OBV has been fluctuating but generally trending upwards, indicating buying pressure.
- Chaikin Money Flow (CMF): The CMF has been negative, suggesting distribution in the stock.
- Conclusion: Volume indicators show mixed signals with a slight bullish bias.
Overall Conclusion:
Based on the analysis of trend, momentum, volatility, and volume indicators, the next few days' possible stock price movement for EIRL is likely to be upward in the short term, supported by the bullish trend and positive volume indicators. However, the mixed signals from momentum indicators and the potential for a breakout in volatility suggest a cautious approach may be warranted. Traders should closely monitor key levels and be prepared for potential reversals or corrections in the near future.
Key Recommendations:
- Monitor Price Action: Keep a close eye on the stock price movement within the Bollinger Bands for potential breakout signals.
- Watch Momentum Indicators: Pay attention to the Stochastic Oscillator for signs of a reversal in the overbought zone.
- Consider Risk Management: Implement stop-loss orders to protect profits and manage downside risk effectively.
- Stay Informed: Stay updated on market news and events that could impact the stock price movement.
In conclusion, while the overall outlook for EIRL suggests an upward bias, it is essential to remain vigilant and adapt to changing market conditions to make informed trading decisions.