Technical Analysis of EJAN 2024-05-10
Overview:
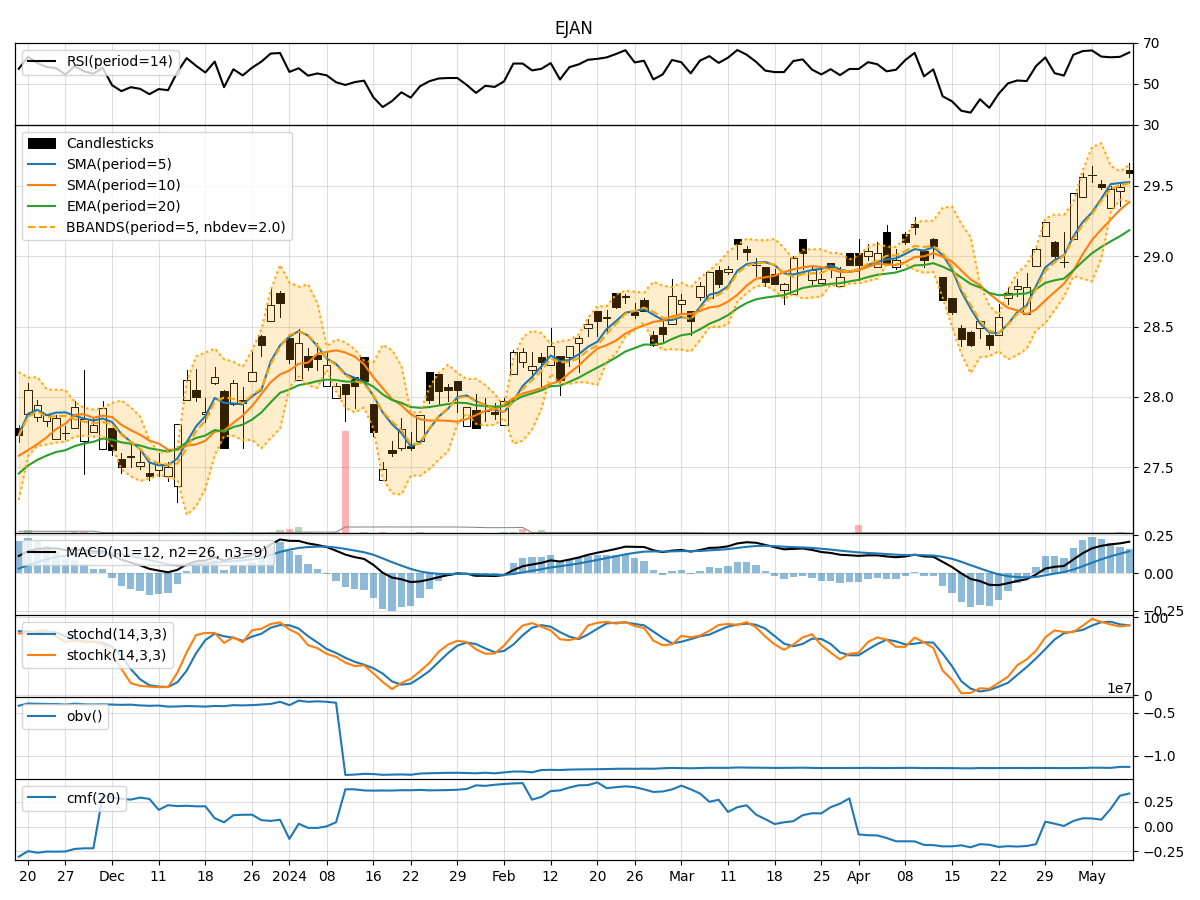
In analyzing the technical indicators for EJAN stock over the last 5 days, we will delve into the trends, momentum, volatility, and volume indicators to provide a comprehensive outlook on the possible future stock price movement. By examining key metrics such as moving averages, MACD, RSI, Bollinger Bands, and volume-related indicators, we aim to offer valuable insights and predictions for the upcoming trading days.
Trend Indicators:
- Moving Averages (MA): The 5-day moving average has been consistently above the closing price, indicating a short-term uptrend.
- MACD: The MACD line has been above the signal line, suggesting bullish momentum.
- EMA: The exponential moving average has been trending upwards, supporting the bullish sentiment.
Key Observation: The trend indicators point towards an upward trajectory for EJAN stock.
Momentum Indicators:
- RSI: The Relative Strength Index has been in the overbought territory but has shown some consolidation in the recent days.
- Stochastic Oscillator: Both %K and %D have been fluctuating but are not in extreme overbought or oversold levels.
- Williams %R: The Williams %R indicator has been hovering around oversold levels but has not shown a clear signal.
Key Observation: The momentum indicators suggest a neutral to slightly bullish momentum for EJAN stock.
Volatility Indicators:
- Bollinger Bands: The stock price has been trading within the Bollinger Bands, indicating a period of consolidation.
- Bollinger %B: The %B indicator has been fluctuating within the bands, reflecting the sideways movement.
- Bollinger Bandwidth: The bandwidth has been relatively stable, suggesting low volatility.
Key Observation: The volatility indicators signal a period of consolidation and low volatility for EJAN stock.
Volume Indicators:
- On-Balance Volume (OBV): The OBV has shown a slight increase, indicating some accumulation by investors.
- Chaikin Money Flow (CMF): The CMF has been positive, reflecting buying pressure in the stock.
Key Observation: The volume indicators imply positive accumulation and buying pressure for EJAN stock.
Conclusion:
Based on the analysis of the technical indicators, EJAN stock is likely to experience further upward movement in the next few trading days. The trend indicators support a bullish outlook, while the momentum indicators suggest a neutral to slightly bullish sentiment. The volatility indicators indicate a period of consolidation, and the volume indicators show positive accumulation and buying pressure.
Overall Assessment: The technical analysis points towards a bullish view for EJAN stock in the upcoming days. Investors may consider maintaining or initiating long positions based on the current market dynamics and indicators' signals.