Technical Analysis of EKG 2024-05-10
Overview:
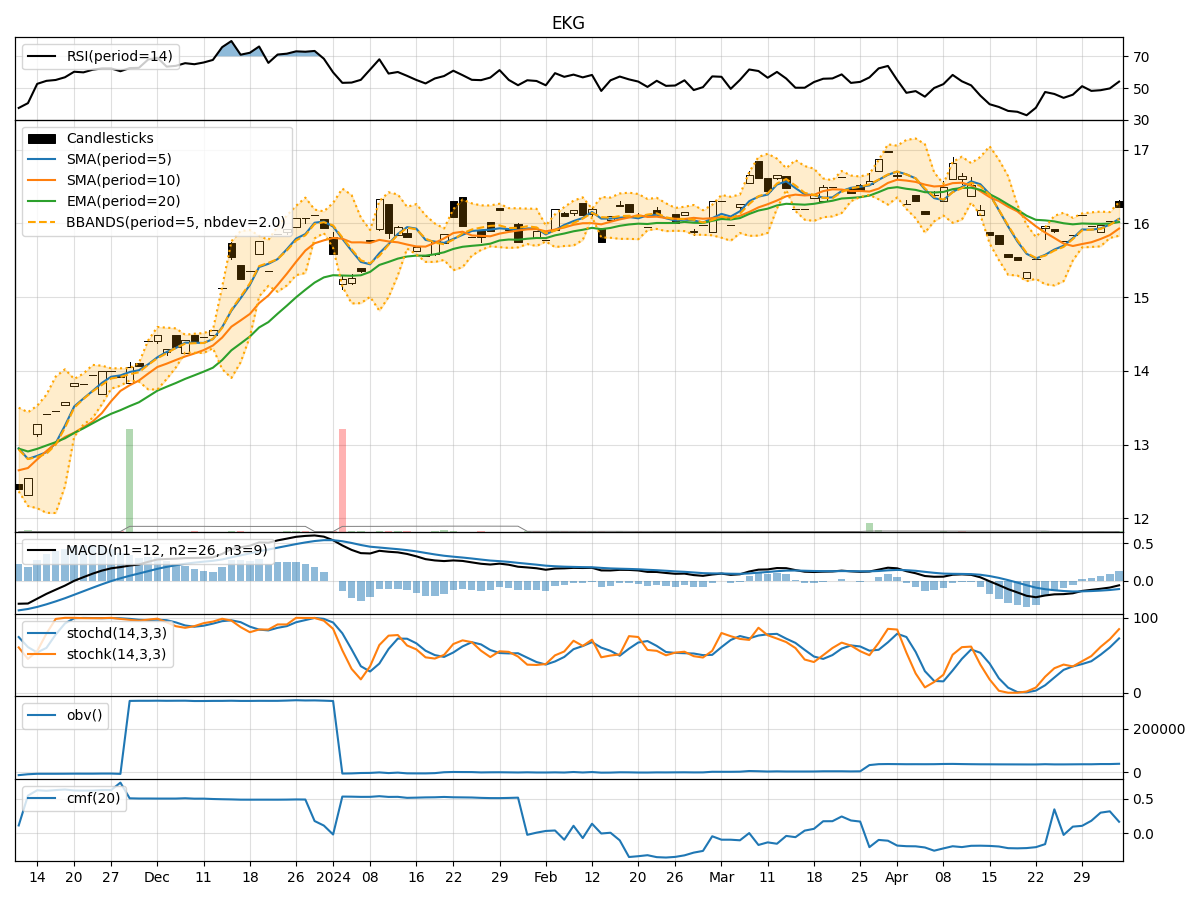
In analyzing the technical indicators for EKG stock over the last 5 days, we will delve into the trends, momentum, volatility, and volume aspects to provide a comprehensive outlook on the possible stock price movement in the coming days. By examining key indicators such as moving averages, MACD, RSI, Bollinger Bands, and OBV, we aim to offer valuable insights and predictions for potential price action.
Trend Analysis:
- Moving Averages (MA): The 5-day MA has been fluctuating around the closing prices, indicating a lack of strong trend direction.
- MACD: The MACD line has been consistently below the signal line, suggesting a bearish momentum in the short term.
Momentum Analysis:
- RSI: The RSI values have been hovering around the mid-range, indicating a neutral sentiment with no extreme overbought or oversold conditions.
- Stochastic Oscillator: The Stochastic indicators show a gradual decline in both %K and %D values, signaling a weakening momentum.
Volatility Analysis:
- Bollinger Bands: The stock price has been trading within the Bollinger Bands, with the bands narrowing slightly, indicating a potential decrease in volatility.
Volume Analysis:
- On-Balance Volume (OBV): The OBV values have been relatively stable, suggesting a balanced accumulation and distribution of the stock.
Key Observations:
- The stock is currently in a sideways consolidation phase with no clear trend direction.
- Momentum is weakening as indicated by the declining Stochastic values.
- Volatility is decreasing based on the narrowing Bollinger Bands.
- Volume is stable with no significant spikes in accumulation or distribution.
Conclusion:
Based on the analysis of the technical indicators, the next few days for EKG stock are likely to see sideways movement with a slight bearish bias. Traders should exercise caution and consider waiting for a clearer trend to emerge before making significant trading decisions. It is advisable to closely monitor key support and resistance levels for potential breakout or breakdown scenarios.