Technical Analysis of EMC 2024-05-10
Overview:
In analyzing the technical indicators for EMC over the last 5 days, we will delve into the trend, momentum, volatility, and volume indicators to provide a comprehensive outlook on the possible stock price movement in the coming days. By examining these key indicators, we aim to offer valuable insights and predictions for informed decision-making.
Trend Analysis:
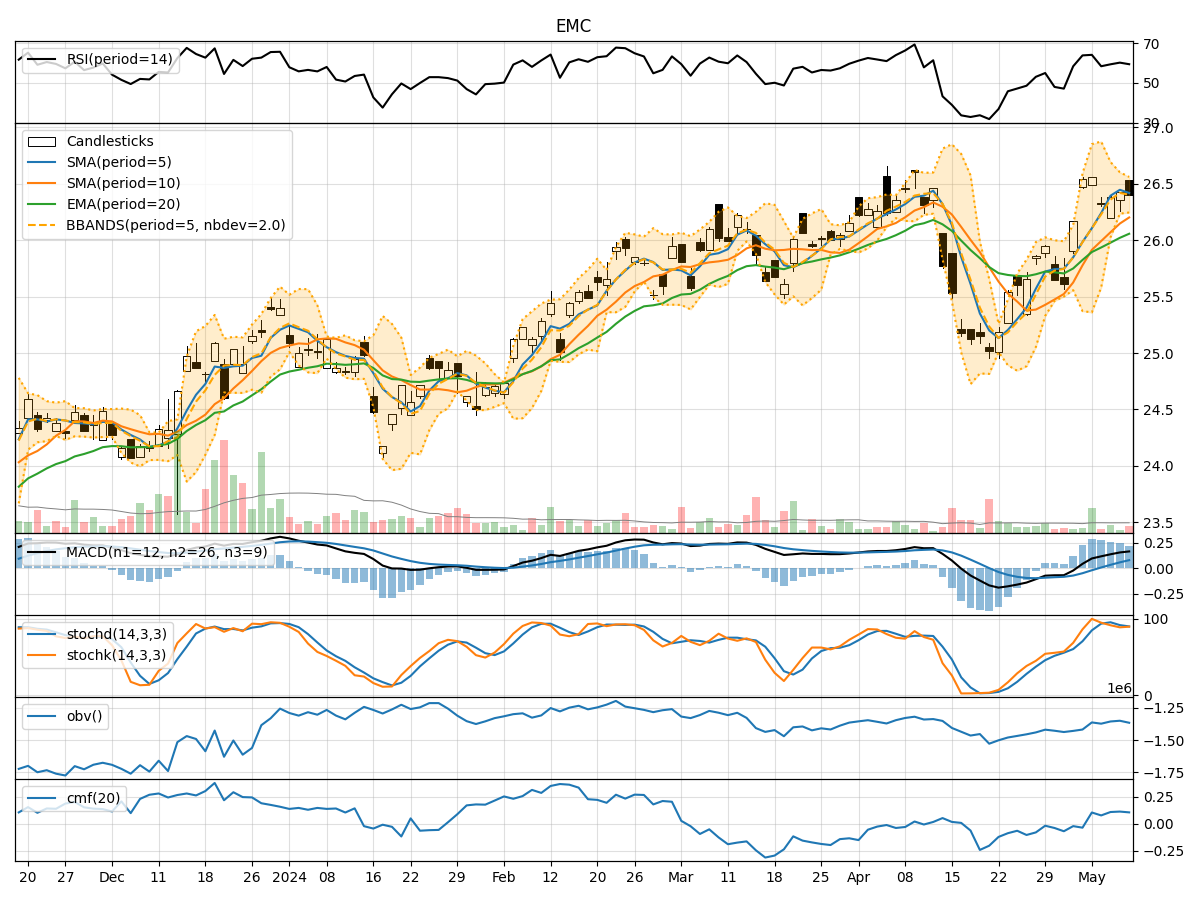
- Moving Averages (MA): The 5-day Moving Average (MA) has been consistently above the Simple Moving Average (SMA) and Exponential Moving Average (EMA), indicating a bullish trend.
- MACD: The MACD line has been consistently above the signal line, with both lines showing an upward trend, suggesting bullish momentum.
Momentum Analysis:
- RSI: The Relative Strength Index (RSI) has been fluctuating around the 60-65 range, indicating a neutral momentum.
- Stochastic Oscillator: Both %K and %D have been hovering around 90, suggesting overbought conditions.
Volatility Analysis:
- Bollinger Bands (BB): The stock price has been trading within the Bollinger Bands, with the bands narrowing, indicating decreasing volatility.
Volume Analysis:
- On-Balance Volume (OBV): The OBV has shown mixed signals, with fluctuations in volume but no clear trend.
- Chaikin Money Flow (CMF): The CMF has been relatively stable around 0.1, indicating moderate buying pressure.
Key Observations:
- The trend indicators suggest a bullish sentiment, supported by the moving averages and MACD.
- Momentum indicators show a neutral stance with slight overbought conditions.
- Volatility has been decreasing, indicating a potential consolidation phase.
- Volume indicators lack a clear trend, reflecting uncertainty in market participation.
Conclusion:
Based on the analysis of the technical indicators, the next few days for EMC stock price movement are likely to be sideways or consolidation. The bullish trend indicated by moving averages and MACD may face resistance due to overbought conditions highlighted by the stochastic oscillator. The decreasing volatility suggests a period of consolidation, while the mixed volume signals imply a lack of strong conviction from market participants. Therefore, it is recommended to closely monitor price action and key support/resistance levels for potential trading opportunities.