Technical Analysis of EMCB 2024-05-10
Overview:
In analyzing the technical indicators for EMCB over the last 5 days, we will delve into the trend, momentum, volatility, and volume indicators to provide a comprehensive outlook on the possible stock price movement in the coming days.
Trend Analysis:
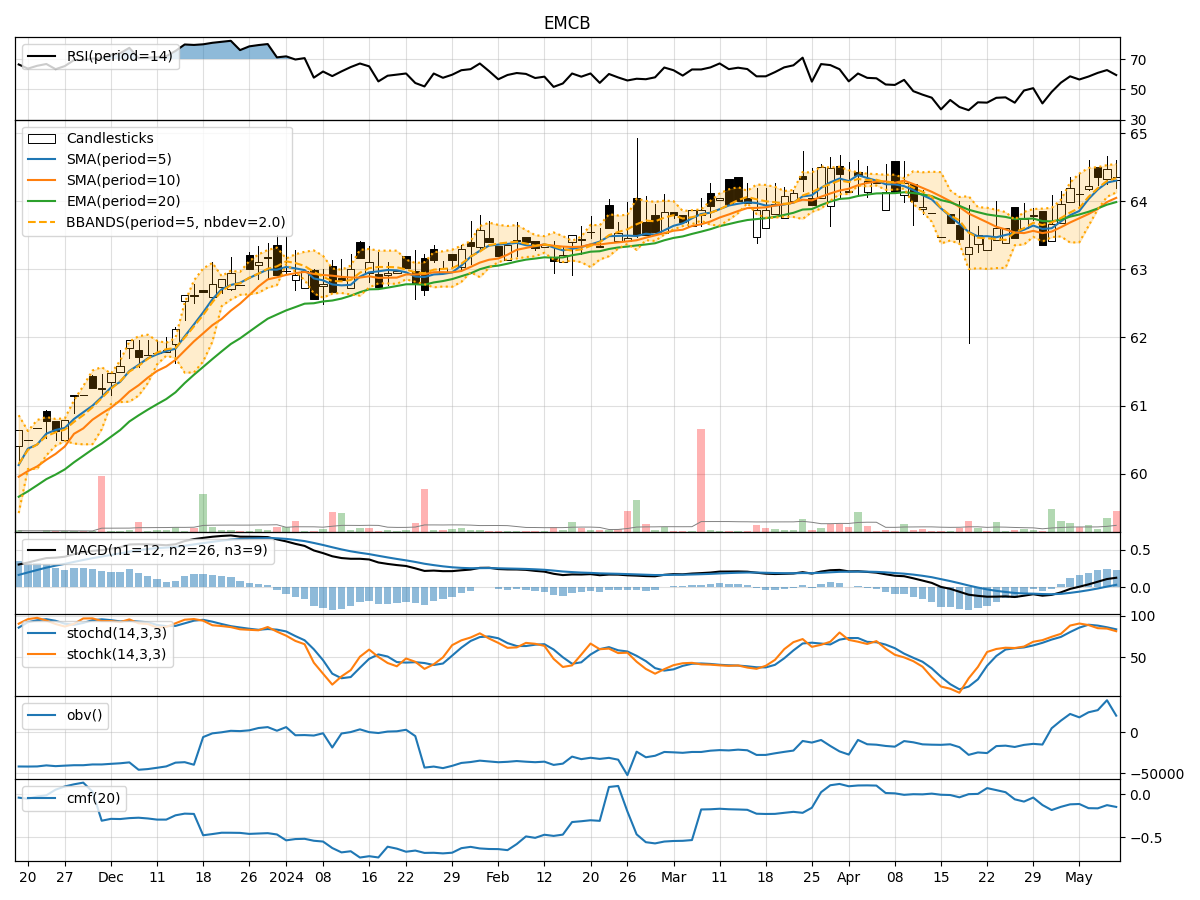
- Moving Averages (MA): The 5-day Moving Average (MA) has been consistently above the Simple Moving Average (SMA) and Exponential Moving Average (EMA), indicating a bullish trend.
- MACD: The MACD line has been consistently above the signal line, with the MACD Histogram showing positive values, suggesting a bullish momentum.
Momentum Analysis:
- RSI: The Relative Strength Index (RSI) has been trending upwards, indicating increasing buying pressure.
- Stochastic Oscillator: Both %K and %D lines of the Stochastic Oscillator have been in the overbought zone, suggesting a strong bullish momentum.
Volatility Analysis:
- Bollinger Bands (BB): The stock price has been trading within the Bollinger Bands, with the bands narrowing, indicating decreasing volatility.
- Bollinger %B: The %B indicator has been hovering around 0.7, suggesting the stock is trading close to the upper band.
Volume Analysis:
- On-Balance Volume (OBV): The OBV has shown mixed movements, indicating indecision among investors.
- Chaikin Money Flow (CMF): The CMF has been negative, suggesting selling pressure in the stock.
Key Observations:
- The trend indicators point towards a bullish sentiment, supported by the moving averages and MACD.
- Momentum indicators reflect a strong bullish momentum, as indicated by RSI and Stochastic Oscillator.
- Volatility indicators suggest a decreasing volatility environment, potentially leading to a consolidation phase.
- Volume indicators show mixed signals, with OBV indicating indecisiveness and CMF reflecting selling pressure.
Conclusion:
Based on the analysis of the technical indicators, the next few days' possible stock price movement for EMCB is likely to be upward with a bullish bias. The strong bullish momentum, supported by the trend indicators, indicates a potential continuation of the uptrend. However, the decreasing volatility and mixed volume signals suggest a possible consolidation phase before further upside movement. Traders and investors should monitor key support and resistance levels for potential entry and exit points, considering the overall bullish outlook for EMCB.