Technical Analysis of EMCC 2024-05-10
Overview:
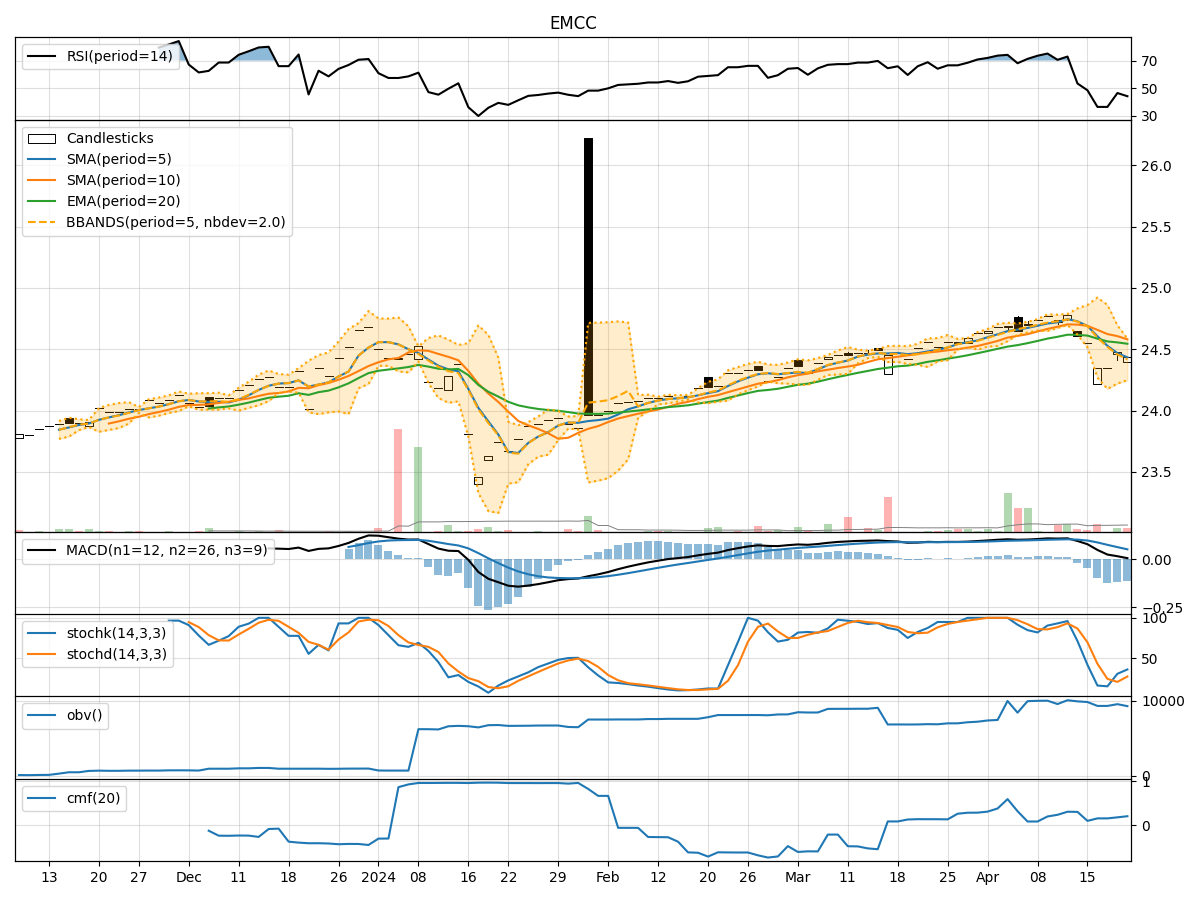
In analyzing the technical indicators for EMCC over the last 5 days, we will delve into the trend, momentum, volatility, and volume indicators to provide a comprehensive outlook on the possible stock price movement. By examining these key aspects, we aim to offer valuable insights and predictions for the upcoming days.
Trend Analysis:
- Moving Averages (MA): The 5-day MA has been consistently above the closing price, indicating a short-term uptrend.
- MACD: The MACD line has been positive, suggesting bullish momentum in the stock.
- EMA: The EMA has been trending upwards, reflecting a positive momentum in the stock price.
Key Observation: The trend indicators suggest a bullish sentiment in the stock price movement.
Momentum Analysis:
- RSI: The RSI has been in the range of 60-70, indicating a moderate level of buying pressure.
- Stochastic Oscillator: Both %K and %D have been gradually decreasing, signaling a potential reversal in momentum.
- Williams %R: The indicator has been in the oversold territory, suggesting a possible buying opportunity.
Key Observation: Momentum indicators show a mixed signal with a slight bearish bias.
Volatility Analysis:
- Bollinger Bands: The stock price has been trading within the bands, indicating a period of consolidation.
- Bollinger %B: The %B has been fluctuating around the midline, suggesting a lack of clear trend direction.
Key Observation: Volatility indicators point towards a period of consolidation and indecision in the stock price.
Volume Analysis:
- On-Balance Volume (OBV): The OBV has been relatively flat, indicating a balance between buying and selling pressure.
- Chaikin Money Flow (CMF): The CMF has been negative, suggesting a net outflow of money from the stock.
Key Observation: Volume indicators reflect a lack of significant buying interest in the stock.
Conclusion:
Based on the analysis of the technical indicators, the stock price of EMCC is likely to experience sideways movement in the next few days. While the trend indicators suggest a bullish sentiment, the momentum indicators show a mixed signal with a slight bearish bias. The volatility indicators indicate a period of consolidation, and the volume indicators reflect a lack of significant buying interest. Therefore, it is recommended to exercise caution and closely monitor the price action for any potential breakout or reversal signals.
Expert Opinion:
As a leading technical analyst, I would advise investors to wait for a clear trend confirmation before making any significant trading decisions. It is essential to consider the overall market conditions and potential catalysts that could impact the stock price movement. Additionally, incorporating risk management strategies and setting stop-loss orders can help mitigate potential losses in case of unexpected price fluctuations.