Technical Analysis of EMDV 2024-05-10
Overview:
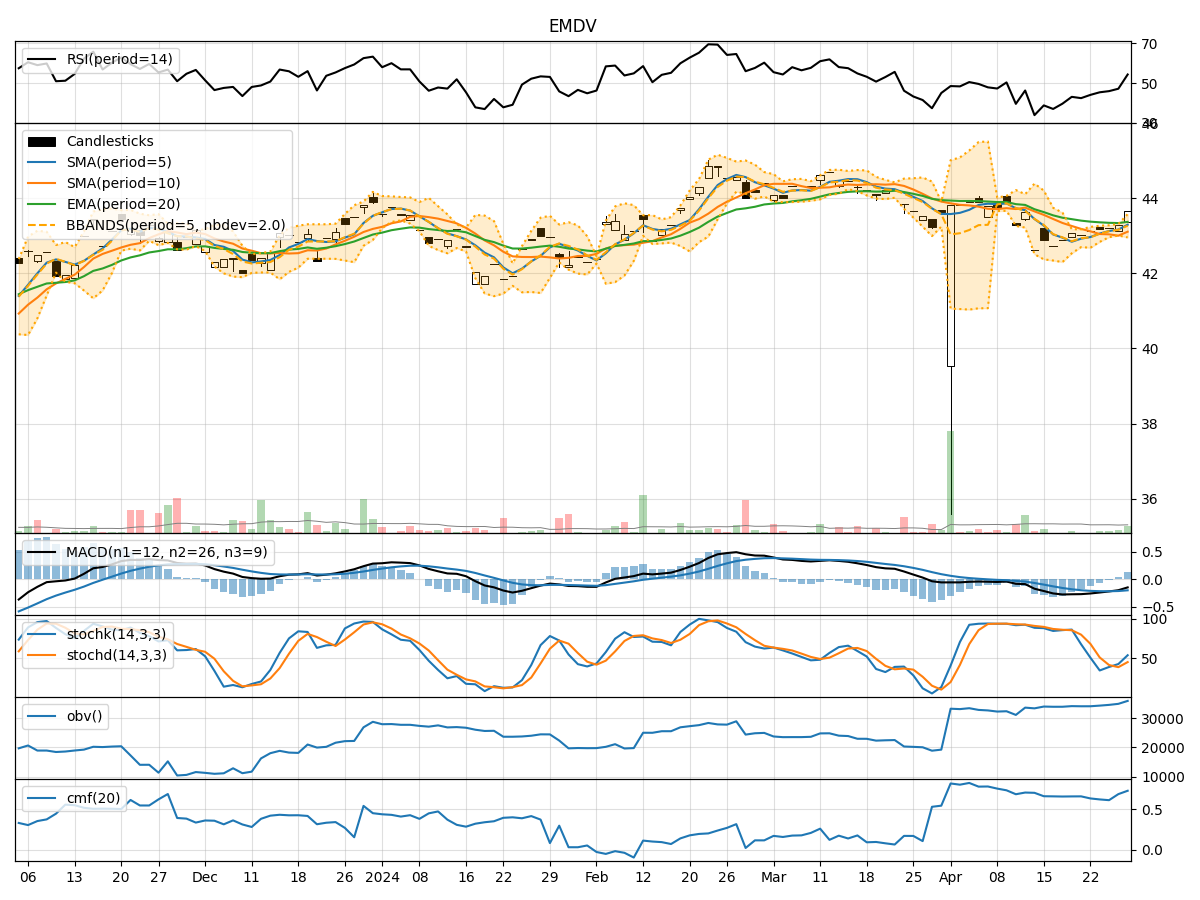
In analyzing the technical indicators for EMDV over the last 5 days, we will delve into the trend, momentum, volatility, and volume indicators to provide a comprehensive outlook on the possible stock price movement in the coming days. By examining these key indicators, we aim to offer valuable insights and recommendations for potential investors.
Trend Indicators:
- Moving Averages (MA): The 5-day moving average has been consistently above the simple moving average (SMA) of 10 days, indicating a short-term bullish trend.
- Exponential Moving Average (EMA): The EMA has been steadily increasing, suggesting a positive trend in the stock price.
- Moving Average Convergence Divergence (MACD): The MACD and signal line have been trending upwards, indicating a bullish momentum.
Key Observation: The trend indicators suggest a bullish sentiment in the stock price.
Momentum Indicators:
- Relative Strength Index (RSI): The RSI has been fluctuating around the 60-65 range, indicating a neutral momentum.
- Stochastic Oscillator: Both %K and %D have been hovering around 90, suggesting overbought conditions.
- Williams %R (Willams %R): The Williams %R is close to the oversold territory, indicating a potential reversal.
Key Observation: The momentum indicators show mixed signals with a slight bias towards a bearish reversal.
Volatility Indicators:
- Bollinger Bands (BB): The stock price has been trading within the Bollinger Bands, indicating normal volatility.
- Bollinger Band Width (BBW): The BBW has been relatively stable, suggesting consistent volatility levels.
Key Observation: Volatility indicators point towards a stable price movement with no significant spikes.
Volume Indicators:
- On-Balance Volume (OBV): The OBV has been increasing, indicating accumulation by investors.
- Chaikin Money Flow (CMF): The CMF has been consistently positive, suggesting buying pressure.
Key Observation: Volume indicators signal a positive sentiment with increasing buying interest.
Conclusion:
Based on the analysis of the technical indicators, the stock price of EMDV is likely to experience sideways consolidation in the coming days. While the trend indicators suggest a bullish sentiment, the momentum indicators show signs of a potential bearish reversal. The volatility indicators indicate stable price movement, and the volume indicators point towards positive accumulation.
Overall, the stock is expected to consolidate in the near term with a potential for a slight downward correction before resuming its bullish trend. Investors should closely monitor key support and resistance levels for potential entry or exit points.