Technical Analysis of EMFM 2024-05-10
Overview:
In analyzing the technical indicators for EMFM stock over the last 5 days, we will delve into the trend, momentum, volatility, and volume indicators to provide a comprehensive outlook on the possible stock price movement in the coming days. By examining these key indicators, we aim to offer valuable insights and predictions for potential investors.
Trend Indicators:
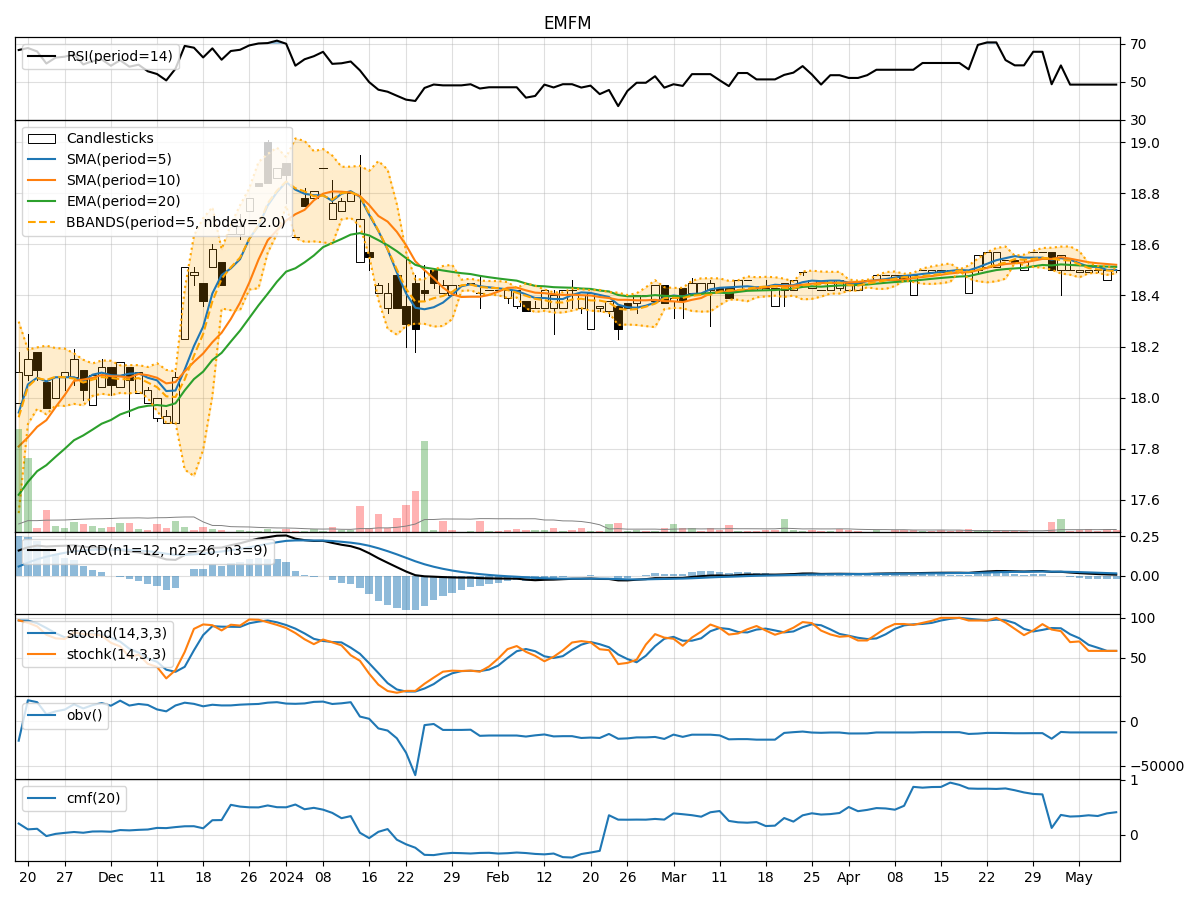
- Moving Averages (MA): The 5-day Moving Average (MA) has been consistently around 18.5, indicating a stable price trend.
- MACD: The MACD line has been positive, suggesting a bullish momentum in the short term.
- EMA: The Exponential Moving Average (EMA) has been slightly decreasing, indicating a potential reversal in the trend.
Momentum Indicators:
- RSI: The Relative Strength Index (RSI) has been around 48.7, indicating a neutral momentum.
- Stochastic Oscillator: Both %K and %D have been around 58.8, suggesting a neutral momentum.
- Williams %R: The indicator has been at -41.2, indicating an oversold condition.
Volatility Indicators:
- Bollinger Bands: The bands have been narrowing, indicating decreasing volatility.
- Bollinger %B: The %B has been around 1.0, suggesting the price is at the upper band, potentially indicating an overbought condition.
Volume Indicators:
- On-Balance Volume (OBV): The OBV has remained constant at 5760, indicating consistent buying pressure.
- Chaikin Money Flow (CMF): The CMF has been increasing, indicating a bullish money flow into the stock.
Key Observations and Opinions:
- Trend: The stock is currently in a sideways trend with a slight bearish bias due to the decreasing EMA.
- Momentum: Momentum indicators suggest a neutral stance with a slight oversold condition based on Williams %R.
- Volatility: Volatility has been decreasing, potentially signaling a period of consolidation.
- Volume: Consistent buying pressure indicated by OBV and increasing CMF points towards bullish sentiment.
Conclusion:
Based on the analysis of the technical indicators, the next few days' possible stock price movement for EMFM is likely to be sideways with a slight bearish bias. Investors should monitor the EMA for potential trend reversals and consider the decreasing volatility as a sign of consolidation. The consistent buying pressure and bullish money flow suggest a potential for a bullish breakout in the near term. However, caution is advised due to the overbought condition indicated by Bollinger %B.