Technical Analysis of EMFQ 2024-05-10
Overview:
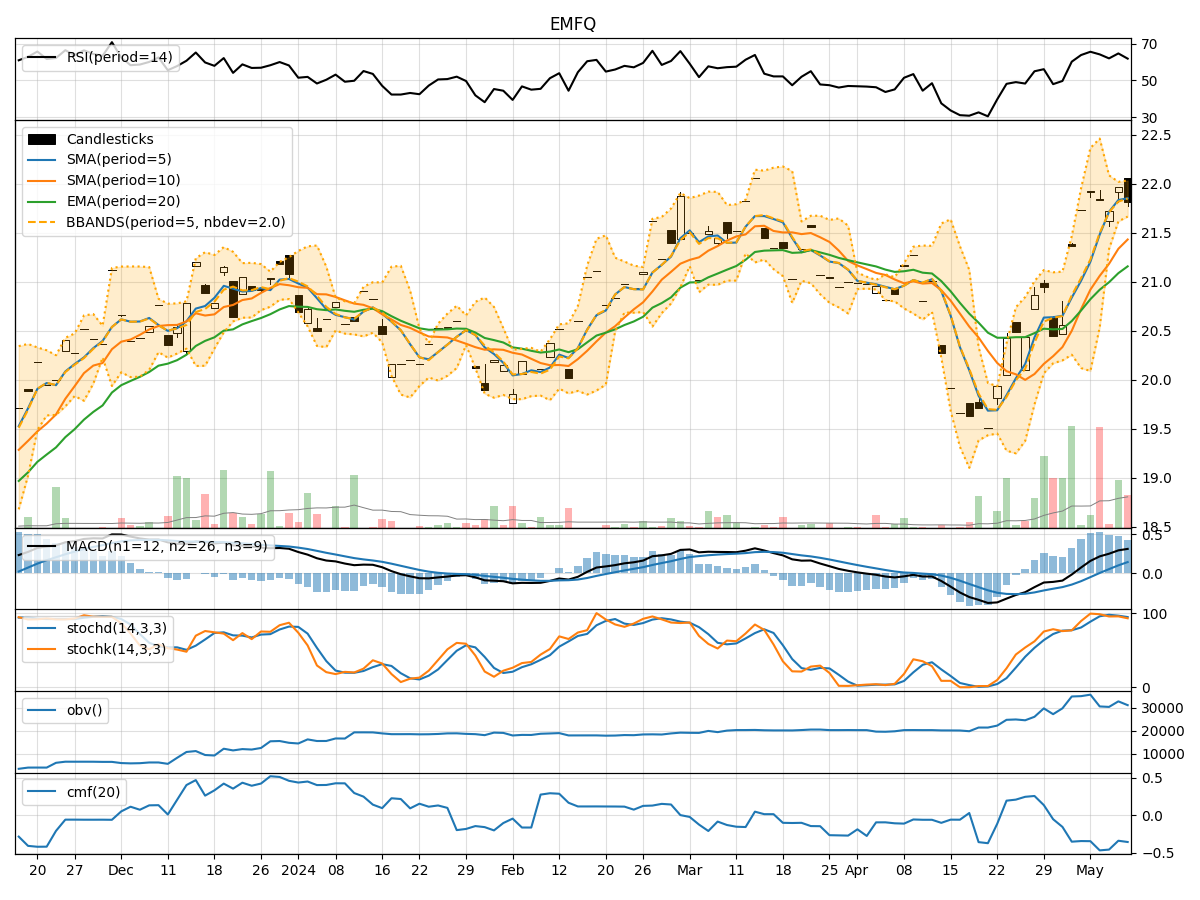
In analyzing the technical indicators for EMFQ stock over the last 5 days, we will delve into the trend, momentum, volatility, and volume indicators to provide a comprehensive outlook on the possible stock price movement in the coming days. By examining these key indicators, we aim to offer valuable insights and predictions for potential investors.
Trend Indicators:
- Moving Averages (MA): The 5-day Moving Average (MA) has been consistently above the Simple Moving Average (SMA) and Exponential Moving Average (EMA), indicating a bullish trend.
- MACD: The Moving Average Convergence Divergence (MACD) has shown positive values, with the MACD line consistently above the Signal line, suggesting upward momentum.
- Conclusion: The trend indicators point towards an upward trend for EMFQ stock.
Momentum Indicators:
- RSI: The Relative Strength Index (RSI) has been fluctuating around the 60-70 range, indicating moderate momentum.
- Stochastic Oscillator: Both %K and %D have been gradually decreasing but remain in the overbought territory, suggesting a potential reversal.
- Conclusion: Momentum indicators suggest a neutral to slightly bearish momentum for EMFQ stock.
Volatility Indicators:
- Bollinger Bands: The stock price has mostly stayed within the Bollinger Bands, with the bands narrowing, indicating decreasing volatility.
- Conclusion: Volatility indicators signal a decreasing volatility for EMFQ stock.
Volume Indicators:
- On-Balance Volume (OBV): The OBV has shown mixed movements, indicating indecision among investors.
- Chaikin Money Flow (CMF): The CMF has been negative, suggesting outflow of money from the stock.
- Conclusion: Volume indicators reflect mixed sentiment among investors for EMFQ stock.
Overall Conclusion:
Based on the analysis of trend, momentum, volatility, and volume indicators, the upward trend indicated by the moving averages and MACD is likely to continue in the short term. However, the neutral to slightly bearish momentum suggested by the RSI and Stochastic Oscillator, coupled with mixed volume indicators, may lead to some consolidation or minor pullback in the stock price.
Recommendation:
Considering the overall analysis, it is advisable to exercise caution in trading EMFQ stock in the next few days. Investors should closely monitor key support and resistance levels, as well as any significant news or market developments that could impact the stock price. It may be prudent to wait for clearer signals or confirmation of a sustained trend before making significant trading decisions.
Disclaimer:
Remember that technical analysis is not foolproof and should be used in conjunction with other forms of analysis and risk management strategies. Market conditions can change rapidly, so staying informed and adaptable is crucial for successful trading in the stock market.