Technical Analysis of EMGF 2024-05-10
Overview:
In analyzing the technical indicators for EMGF stock over the last 5 days, we will delve into the trend, momentum, volatility, and volume indicators to provide a comprehensive outlook on the possible stock price movement in the coming days. By examining these key indicators, we aim to offer valuable insights and recommendations for potential investors.
Trend Indicators:
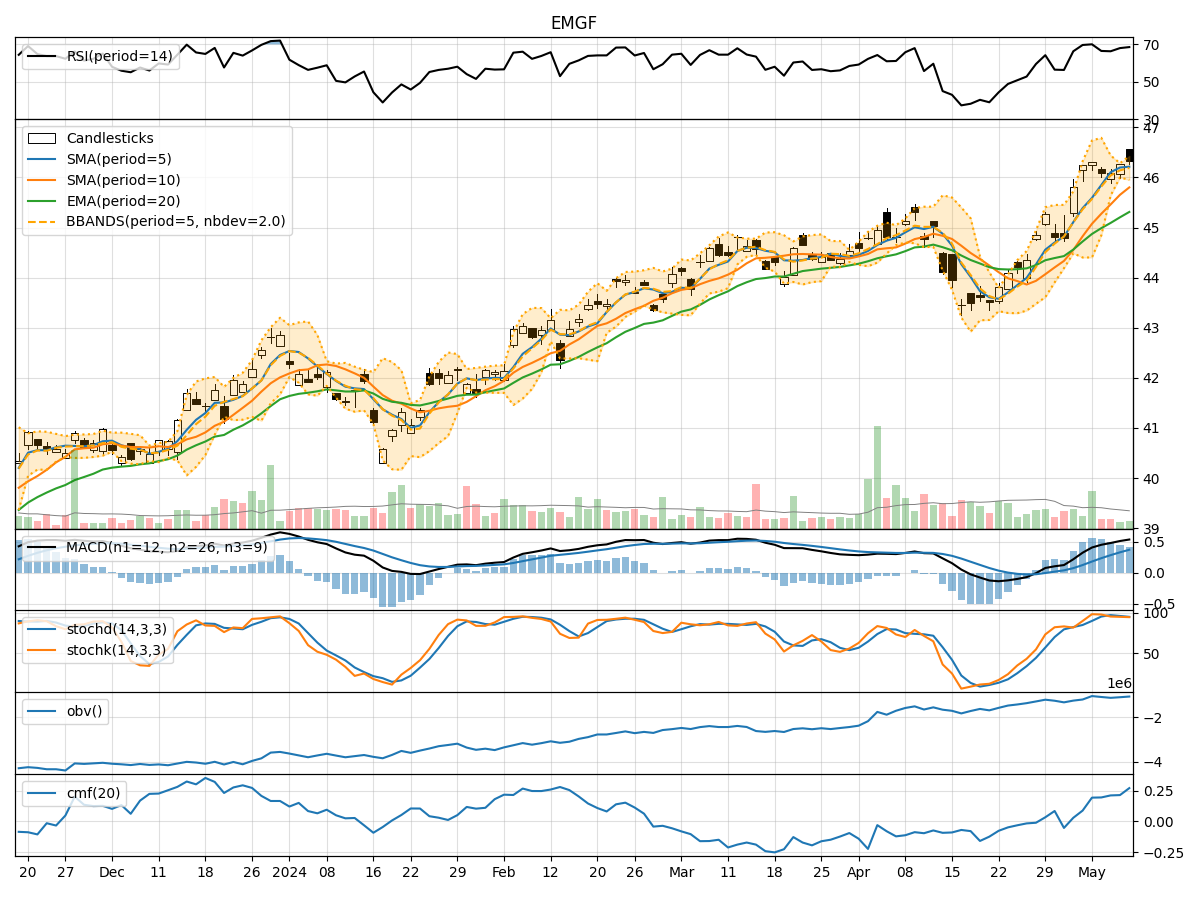
- Moving Averages (MA): The 5-day MA has been consistently above the closing prices, indicating a bullish trend.
- MACD: The MACD line has been above the signal line, suggesting a bullish momentum.
- EMA: The exponential moving average has been trending upwards, supporting the bullish sentiment.
Momentum Indicators:
- RSI: The RSI has been in the overbought territory, indicating a strong bullish momentum.
- Stochastic Oscillator: Both %K and %D have been high, signaling an overbought condition.
- Williams %R: The indicator has been in the oversold region, suggesting a potential reversal.
Volatility Indicators:
- Bollinger Bands: The stock price has been trading within the bands, indicating a stable but slightly expanding volatility.
- Bollinger %B: The %B indicator has been fluctuating around the midline, reflecting a neutral stance.
Volume Indicators:
- On-Balance Volume (OBV): The OBV has been increasing, indicating accumulation by investors.
- Chaikin Money Flow (CMF): The CMF has been positive, suggesting buying pressure in the stock.
Key Observations:
- The trend indicators show a strong bullish sentiment with moving averages and MACD supporting an upward trend.
- Momentum indicators indicate an overbought condition, which might lead to a potential pullback or consolidation.
- Volatility remains relatively stable with a slight expansion, suggesting a moderate level of risk.
- Volume indicators reflect positive accumulation and buying pressure in the stock.
Conclusion:
Based on the analysis of the technical indicators, the stock price of EMGF is likely to experience a short-term pullback or consolidation due to the overbought conditions indicated by the momentum indicators. However, the overall trend remains bullish, supported by moving averages and MACD. Investors should consider potential profit-taking opportunities or wait for a better entry point during the consolidation phase. It is essential to monitor the price action closely for any signs of a trend reversal or continuation of the current bullish momentum.