Technical Analysis of EMHY 2024-05-10
Overview:
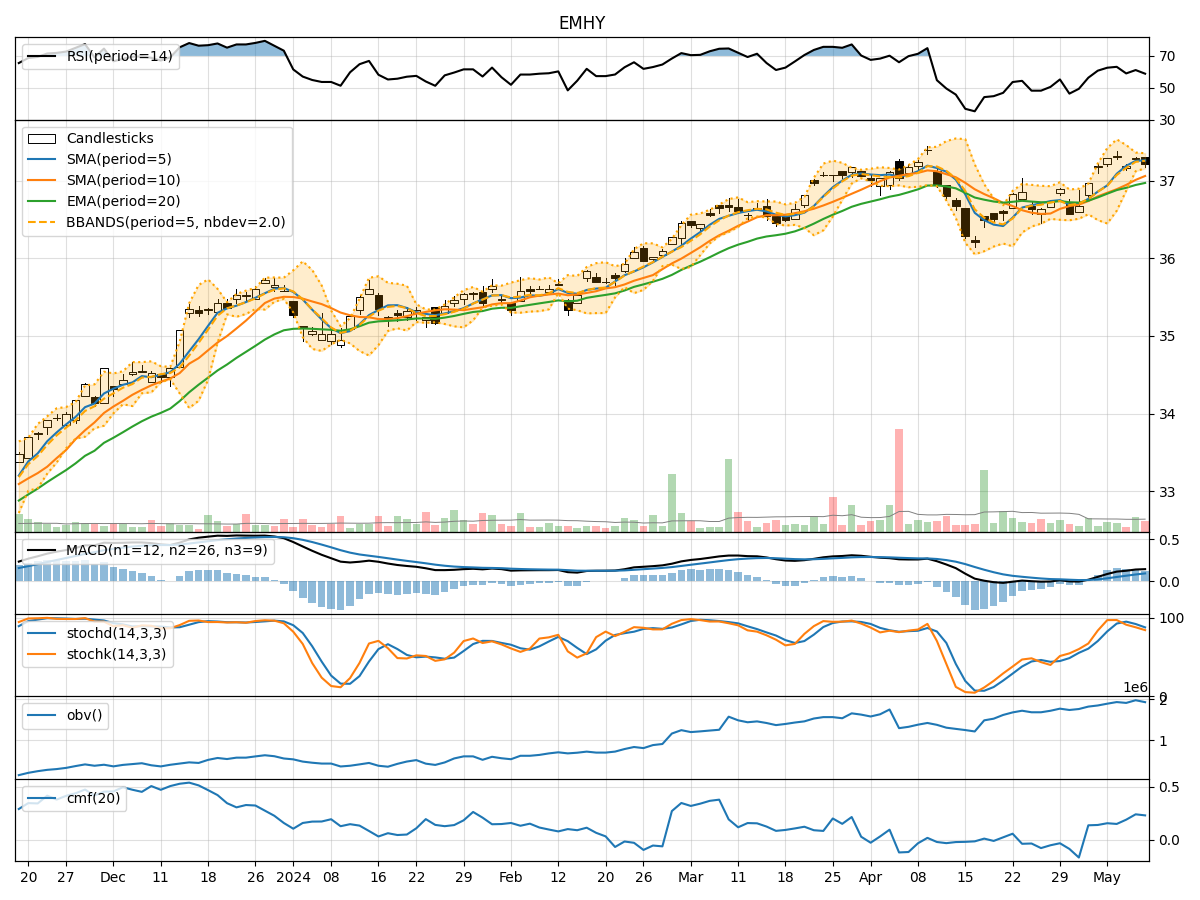
In analyzing the technical indicators for EMHY over the last 5 days, we will delve into the trend, momentum, volatility, and volume indicators to provide a comprehensive outlook on the possible stock price movement. By examining these key aspects, we aim to offer valuable insights and predictions for the upcoming trading days.
Trend Analysis:
- Moving Averages (MA): The 5-day Moving Average (MA) has been consistently above the Simple Moving Average (SMA) and Exponential Moving Average (EMA), indicating a bullish trend.
- MACD: The MACD line has been above the signal line, with both lines showing an upward trend, suggesting bullish momentum.
Momentum Analysis:
- RSI: The Relative Strength Index (RSI) has been fluctuating around the 60-65 range, indicating a neutral momentum.
- Stochastic Oscillator: Both %K and %D have been gradually decreasing, signaling a potential bearish momentum shift.
Volatility Analysis:
- Bollinger Bands (BB): The stock price has been trading within the Bollinger Bands, with the bands narrowing, suggesting decreased volatility.
Volume Analysis:
- On-Balance Volume (OBV): The OBV has shown a slight increase over the last 5 days, indicating some accumulation by investors.
- Chaikin Money Flow (CMF): The CMF has been positive, reflecting buying pressure in the stock.
Key Observations:
- The trend indicators suggest a bullish sentiment in the short term.
- Momentum indicators show a mixed signal, with RSI neutral and Stochastic Oscillator hinting at a potential bearish reversal.
- Volatility has been decreasing, indicating a possible period of consolidation.
- Volume indicators point towards some accumulation by investors.
Conclusion:
Based on the analysis of the technical indicators, the next few days' possible stock price movement for EMHY could be sideways with a slight bearish bias. While the trend indicators remain bullish, the momentum indicators suggest a potential shift towards bearish sentiment. The decreasing volatility and slight increase in volume accumulation further support a sideways movement. Traders should closely monitor the Stochastic Oscillator for confirmation of a bearish reversal and consider setting tight stop-loss levels to manage risk effectively.