Technical Analysis of EMIF 2024-05-10
Overview:
In analyzing the technical indicators for EMIF stock over the last 5 days, we will delve into the trends, momentum, volatility, and volume indicators to provide a comprehensive outlook on the possible stock price movement in the coming days. By examining key metrics such as moving averages, MACD, RSI, Bollinger Bands, and OBV, we aim to offer valuable insights and predictions for potential investors.
Trend Indicators:
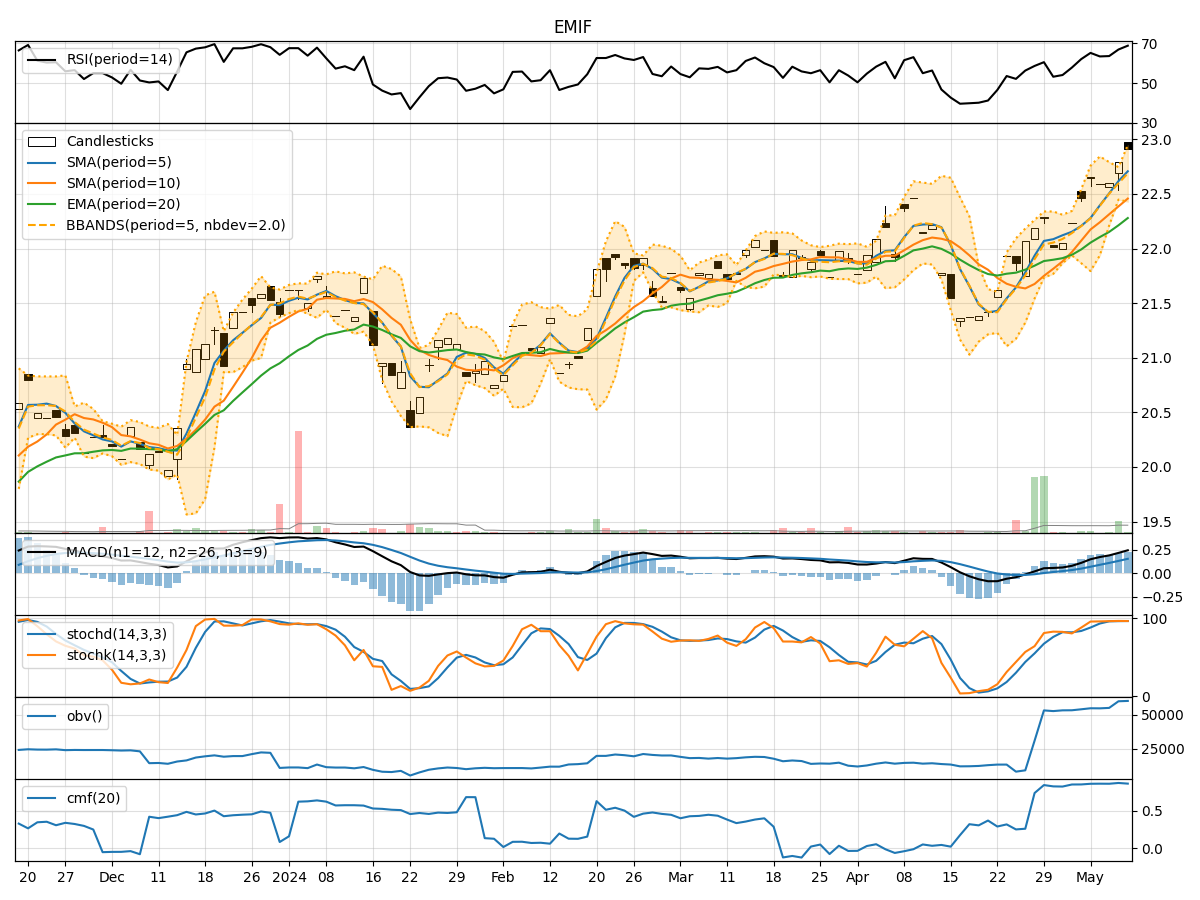
- Moving Averages (MA): The 5-day moving average has been consistently above the longer-term SMAs, indicating a short-term uptrend.
- MACD: The MACD line has been trending upwards, crossing above the signal line, suggesting bullish momentum.
- EMA: The exponential moving average has been steadily increasing, supporting the bullish sentiment.
Momentum Indicators:
- RSI: The RSI has been in the overbought territory, indicating strong buying pressure.
- Stochastic Oscillator: Both %K and %D have been high, signaling potential overbought conditions.
- Williams %R: The indicator has been in the oversold region, suggesting a possible reversal.
Volatility Indicators:
- Bollinger Bands: The stock price has been trading within the bands, indicating moderate volatility.
- Bollinger %B: The %B indicator has been fluctuating around the midline, reflecting consolidation.
- Bollinger Band Width: The band width has been relatively stable, suggesting a lack of significant price expansion.
Volume Indicators:
- On-Balance Volume (OBV): The OBV has been trending upwards, indicating accumulation by investors.
- Chaikin Money Flow (CMF): The CMF has been positive, suggesting money flow into the stock.
Key Observations and Opinions:
- Trend: The stock is in an upward trend based on moving averages and MACD.
- Momentum: Momentum indicators suggest a strong buying pressure but also potential overbought conditions.
- Volatility: Volatility is moderate, with the stock trading within Bollinger Bands.
- Volume: Accumulation is evident based on OBV and CMF.
Conclusion:
Based on the analysis of technical indicators, the next few days for EMIF stock are likely to see continued upward movement with moderate volatility and strong buying pressure. Investors should monitor for potential signs of overbought conditions and consider taking profits strategically. Overall, the outlook remains bullish in the short term.