Technical Analysis of EMLC 2024-05-10
Overview:
In analyzing the technical indicators for EMLC over the last 5 days, we will delve into the trend, momentum, volatility, and volume indicators to provide a comprehensive outlook on the possible stock price movement. By examining these key indicators, we aim to offer valuable insights and predictions for the upcoming days.
Trend Analysis:
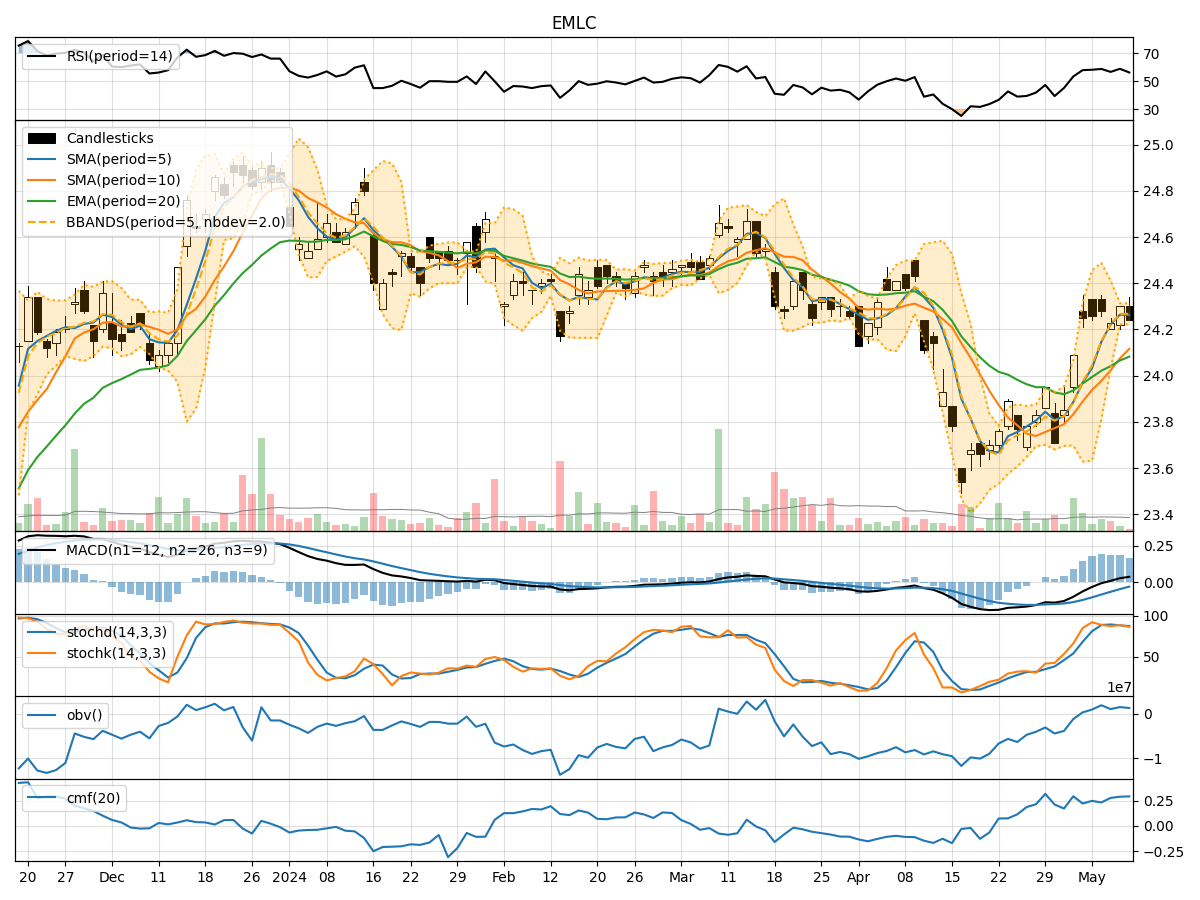
- Moving Averages (MA): The 5-day MA has been consistently above the closing price, indicating a bullish trend.
- MACD: The MACD line has been positive, with the MACD histogram showing an increasing trend, suggesting bullish momentum.
- Relative Strength Index (RSI): The RSI has been fluctuating around the overbought territory, indicating strong buying pressure.
Momentum Analysis:
- Stochastic Oscillator: Both %K and %D have been in the overbought zone, signaling a potential reversal or consolidation.
- Williams %R (WillR): The indicator has been hovering in the oversold region, suggesting a possible buying opportunity.
Volatility Analysis:
- Bollinger Bands (BB): The bands have been relatively narrow, indicating low volatility and a potential breakout in either direction.
- Bollinger %B (BBP): The %B indicator has been fluctuating around the middle, suggesting a balanced market sentiment.
Volume Analysis:
- On-Balance Volume (OBV): The OBV has shown a slight increase, indicating accumulation by investors.
- Chaikin Money Flow (CMF): The CMF has been positive, reflecting buying pressure in the market.
Key Observations:
- The trend indicators suggest a bullish sentiment, supported by positive MACD and RSI readings.
- Momentum indicators show signs of overbought conditions, hinting at a possible correction or consolidation.
- Volatility remains relatively low, indicating a period of indecision or potential buildup for a breakout.
- Volume indicators point towards accumulation and positive money flow into the stock.
Conclusion:
Based on the analysis of the technical indicators, the stock is likely to experience a short-term consolidation or minor pullback due to overbought momentum signals. However, the overall trend remains bullish, supported by strong moving averages and positive MACD readings. Traders should watch for potential entry points during any dips or consolidation phases, while investors can consider holding their positions for further upside potential. It is essential to monitor key support and resistance levels for confirmation of the stock's next directional move.