Technical Analysis of EMM 2024-05-10
Overview:
In analyzing the technical indicators for EMM stock over the last 5 days, we will delve into the trend, momentum, volatility, and volume indicators to provide a comprehensive outlook on the possible stock price movement in the coming days. By examining these key indicators, we aim to offer valuable insights and predictions for potential investors.
Trend Analysis:
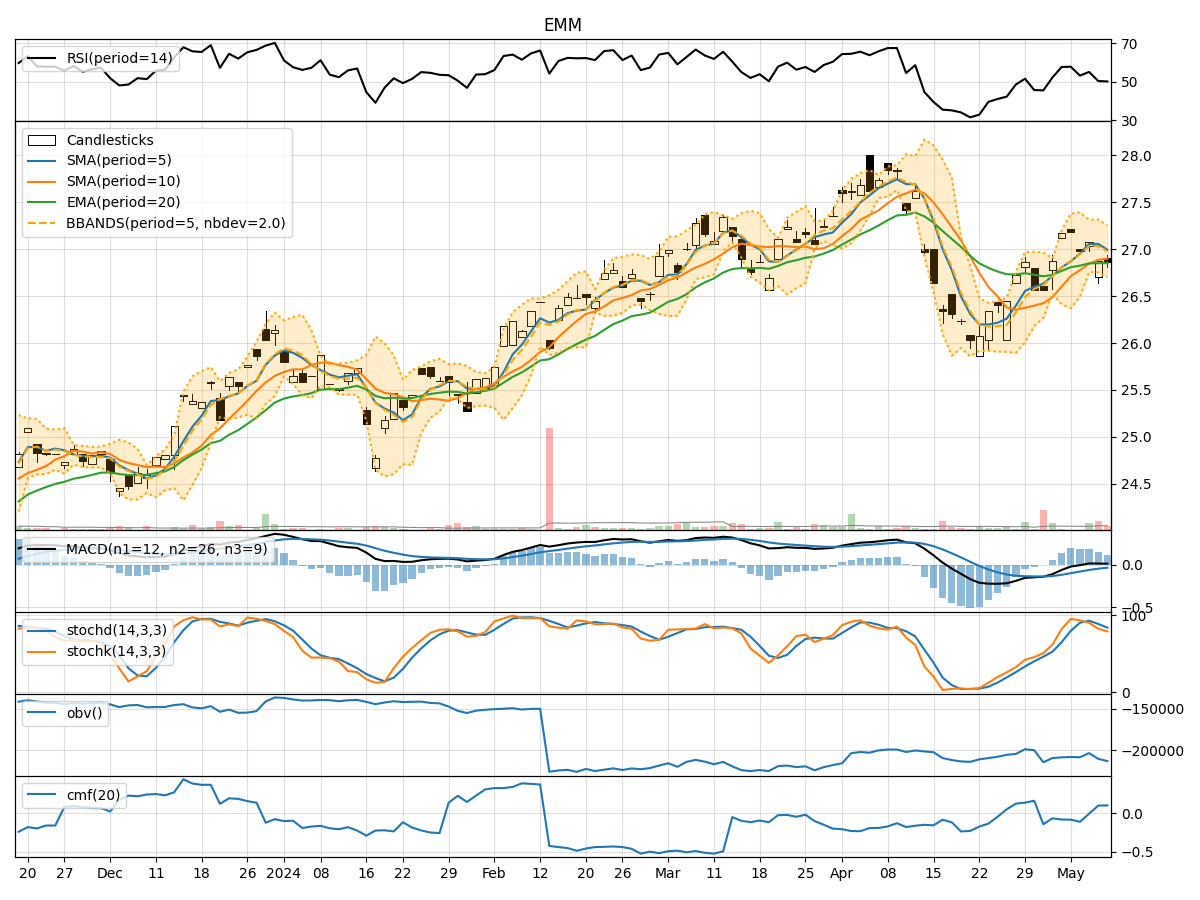
- Moving Averages (MA): The 5-day Moving Average (MA) has been relatively stable around the $26.90-$27.00 range, indicating a neutral trend.
- MACD: The Moving Average Convergence Divergence (MACD) shows a slight positive momentum, with the MACD line crossing above the signal line, suggesting a potential bullish signal.
- RSI: The Relative Strength Index (RSI) has been fluctuating around the mid-level, indicating a balanced momentum.
Momentum Analysis:
- Stochastic Oscillator: The Stochastic Oscillator reflects a downward trend, with both %K and %D values decreasing over the past few days.
- Williams %R: The Williams %R indicator is in the oversold territory, suggesting a potential reversal or consolidation phase.
Volatility Analysis:
- Bollinger Bands: The Bollinger Bands are narrowing, indicating decreasing volatility and a possible period of consolidation.
- Average True Range (ATR): The ATR values have been relatively low, signaling a lack of significant price movements.
Volume Analysis:
- On-Balance Volume (OBV): The OBV has shown a slight decline, indicating selling pressure in the stock.
- Chaikin Money Flow (CMF): The CMF has been negative, suggesting a bearish sentiment among investors.
Conclusion:
Based on the analysis of the technical indicators, the stock of EMM is likely to experience sideways movement in the coming days. The neutral trend indicated by the moving averages, coupled with the mixed momentum signals from the MACD and RSI, suggests a lack of clear direction. The decreasing volatility and negative volume indicators further support the view of a potential consolidation phase.
In conclusion, the next few days for EMM stock are expected to be characterized by sideways trading with a neutral bias. Investors should exercise caution and closely monitor key support and resistance levels for potential breakout opportunities.