Technical Analysis of EMSF 2024-05-10
Overview:
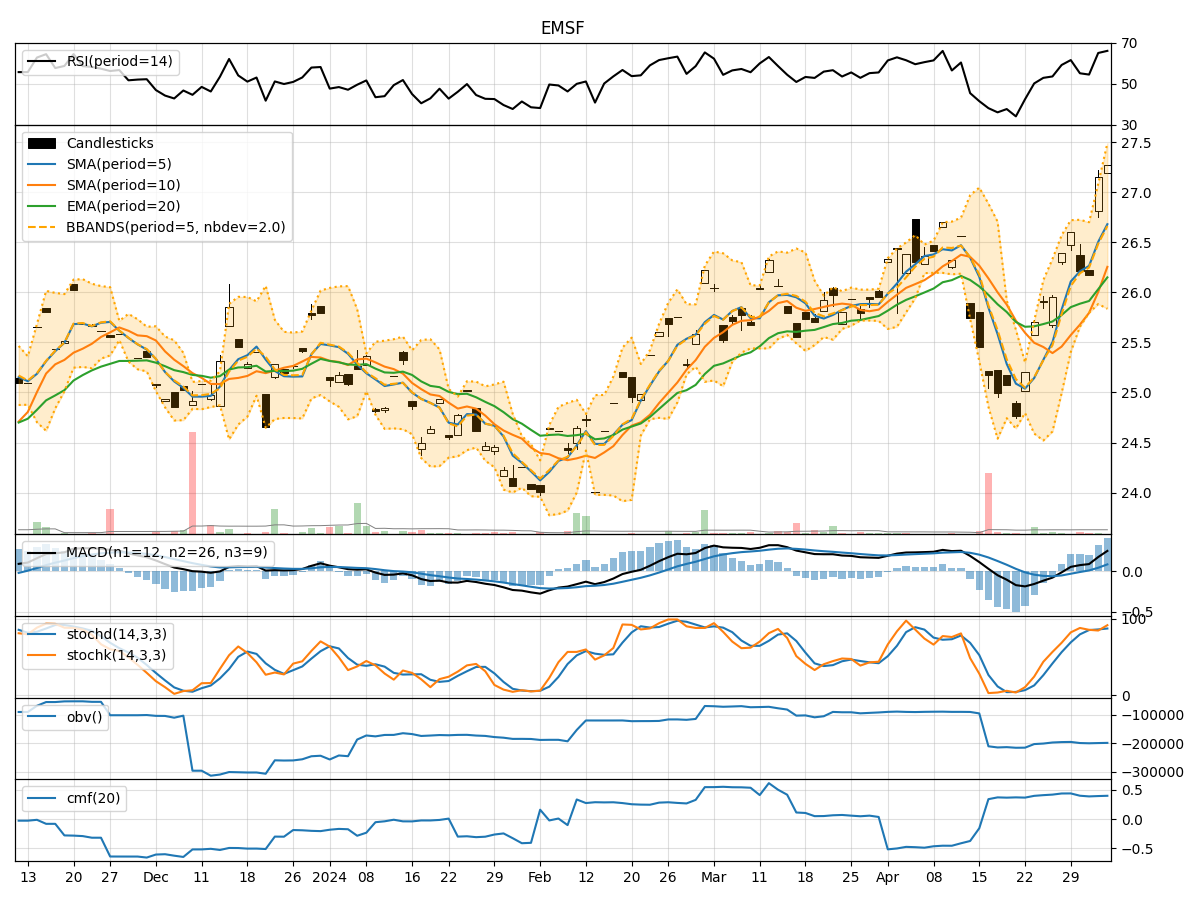
In analyzing the technical indicators for EMSF over the last 5 days, we will delve into the trend, momentum, volatility, and volume indicators to provide a comprehensive outlook on the possible stock price movement in the coming days.
Trend Analysis:
- Moving Averages (MA): The 5-day Moving Average (MA) has been fluctuating around the Simple Moving Average (SMA) and Exponential Moving Average (EMA) values, indicating a lack of clear trend direction.
- MACD: The MACD line has been positive, but the MACD Histogram has been decreasing, suggesting a potential weakening of the bullish momentum.
Momentum Analysis:
- RSI: The Relative Strength Index (RSI) has been oscillating around the neutral 50 level, indicating a lack of strong momentum in either direction.
- Stochastic Oscillator: Both %K and %D values have been declining, signaling a potential bearish momentum shift.
- Williams %R: The Williams %R indicator has been in oversold territory, suggesting a possible reversal to the upside.
Volatility Analysis:
- Bollinger Bands (BB): The stock price has been trading within the Bollinger Bands, with the bands narrowing, indicating decreasing volatility.
- Bollinger %B: The %B value has been hovering around the middle range, reflecting a neutral stance in terms of volatility.
Volume Analysis:
- On-Balance Volume (OBV): The OBV has been negative, indicating selling pressure in the stock.
- Chaikin Money Flow (CMF): The CMF has been relatively stable around the 0.40 level, suggesting a balance between buying and selling pressure.
Key Observations and Opinions:
- Trend: The lack of clear trend direction in the moving averages and the weakening MACD Histogram signal a potential consolidation phase.
- Momentum: The mixed signals from RSI, Stochastic Oscillator, and Williams %R indicate indecision among traders.
- Volatility: The narrowing Bollinger Bands and stable %B value point towards a period of low volatility.
- Volume: The negative OBV and stable CMF suggest a balance between buying and selling pressure.
Conclusion:
Based on the analysis of the technical indicators, the stock price of EMSF is likely to experience sideways movement in the next few days. The lack of a clear trend, mixed momentum signals, low volatility, and balanced volume indicate a period of consolidation. Traders should exercise caution and wait for clearer signals before making significant trading decisions.