Technical Analysis of EMSG 2024-05-10
Overview:
In analyzing the technical indicators for EMSG stock over the last 5 days, we will delve into the trend, momentum, volatility, and volume indicators to provide a comprehensive outlook on the possible stock price movement in the coming days. By examining these key indicators, we aim to offer valuable insights and predictions for potential investors.
Trend Indicators:
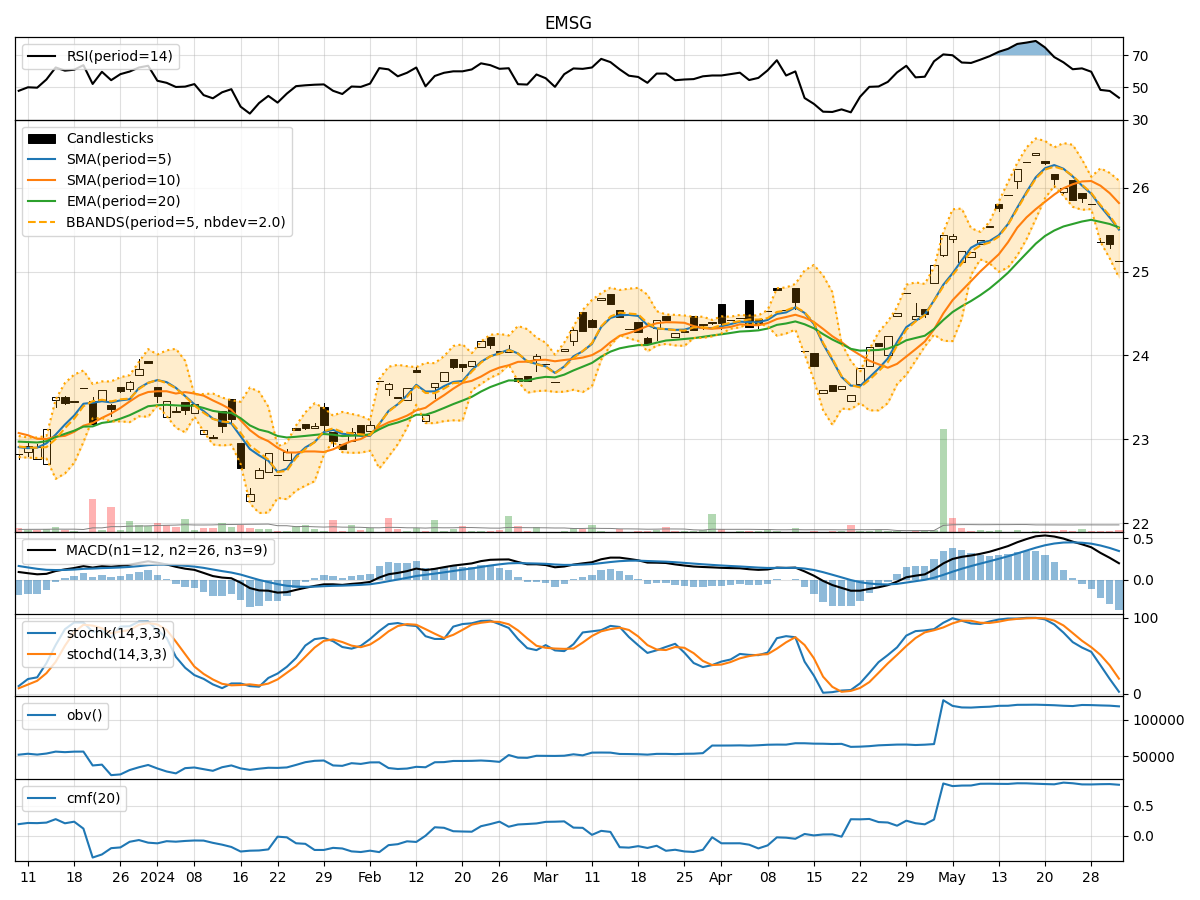
- Moving Averages (MA): The 5-day MA has been consistently above the 10-day SMA, indicating a short-term bullish trend. The EMA(20) has been steadily increasing, suggesting a positive momentum in the stock price.
- MACD: The MACD line has been above the signal line for the past 5 days, with both lines showing an upward trend. This signals a bullish momentum in the stock.
- Conclusion: The trend indicators suggest a bullish outlook for EMSG stock in the coming days.
Momentum Indicators:
- RSI: The RSI has been hovering around the overbought territory, indicating a strong buying momentum in the stock.
- Stochastic Oscillator: Both %K and %D lines have been in the overbought zone, suggesting a potential reversal or consolidation in the stock price.
- Conclusion: The momentum indicators point towards a potential consolidation or reversal in the stock price movement.
Volatility Indicators:
- Bollinger Bands: The stock price has been trading within the upper Bollinger Band, indicating an overbought condition. The bands are relatively narrow, suggesting a period of low volatility.
- Conclusion: The volatility indicators imply a potential pullback or consolidation in the stock price.
Volume Indicators:
- On-Balance Volume (OBV): The OBV has been steadily increasing over the past 5 days, indicating strong buying pressure in the stock.
- Chaikin Money Flow (CMF): The CMF(20) has been consistently positive, reflecting a healthy inflow of money into the stock.
- Conclusion: The volume indicators support a bullish sentiment in the stock.
Overall Conclusion:
Based on the analysis of the trend, momentum, volatility, and volume indicators, the overall outlook for EMSG stock in the next few days is bullish. The trend indicators suggest a continued upward momentum, while the volume indicators indicate strong buying pressure. However, the momentum indicators hint at a potential consolidation or reversal, and the volatility indicators point towards a possible pullback. Therefore, while the stock may experience some short-term fluctuations, the overall trend remains positive. Investors should consider these factors and monitor the stock closely for any signs of a reversal or consolidation.