Technical Analysis of EMXC 2024-05-10
Overview:
In analyzing the technical indicators for EMXC over the last 5 days, we will delve into the trend, momentum, volatility, and volume indicators to provide a comprehensive outlook on the possible stock price movement in the coming days. By examining these key aspects, we aim to offer valuable insights and predictions to guide your investment decisions.
Trend Analysis:
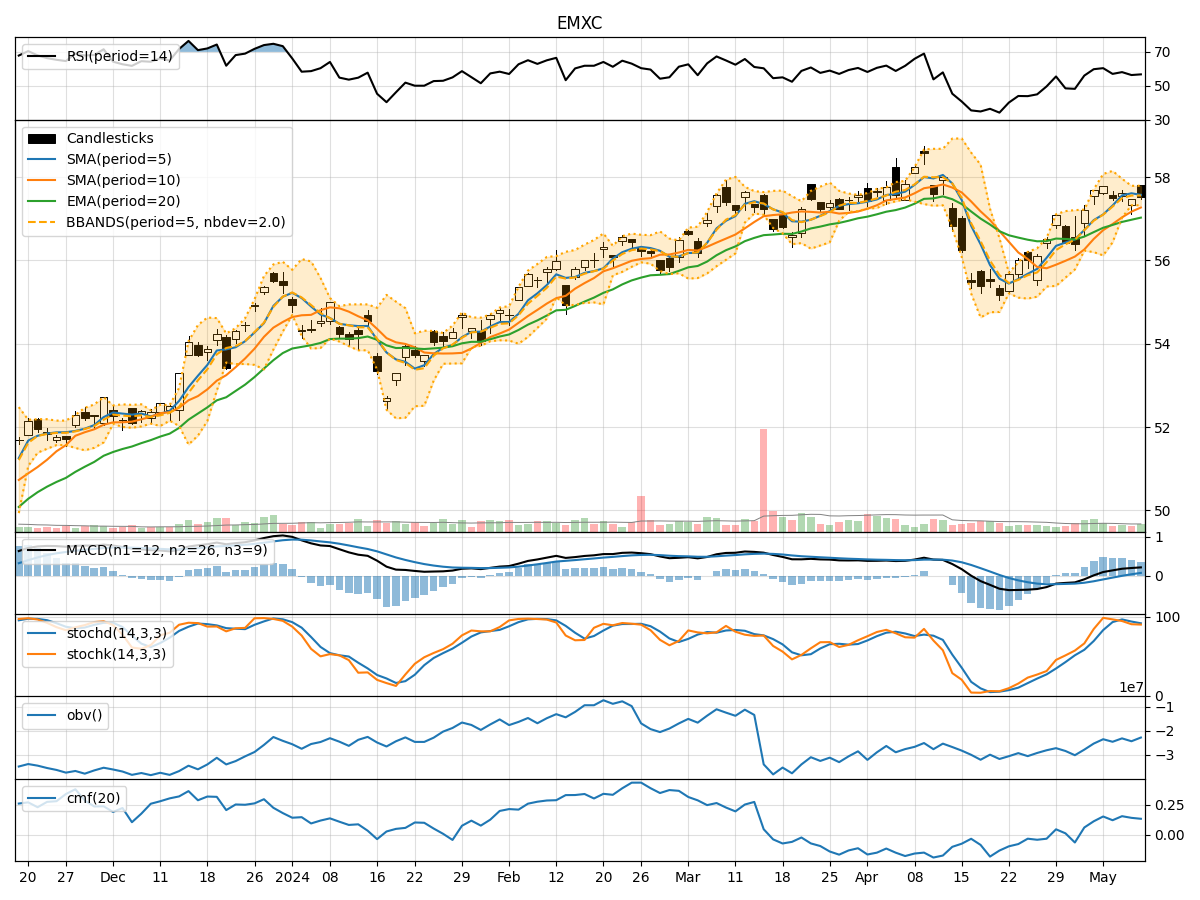
- Moving Averages (MA): The 5-day MA has been consistently above the closing prices, indicating an upward trend.
- MACD: The MACD line has been above the signal line, suggesting a bullish momentum.
- EMA: The EMA values have been increasing, supporting the bullish trend.
Key Observation: The trend indicators point towards a bullish outlook for EMXC.
Momentum Analysis:
- RSI: The RSI values have been fluctuating but generally staying within the neutral range.
- Stochastic Oscillator: Both %K and %D values have been declining, indicating a potential reversal.
- Williams %R: The values have been in the oversold territory, suggesting a possible buying opportunity.
Key Observation: The momentum indicators signal a neutral to slightly bearish sentiment.
Volatility Analysis:
- Bollinger Bands (BB): The stock price has been trading within the bands, showing stability.
- Bollinger %B: The %B values have been fluctuating around the midline, indicating balanced volatility.
Key Observation: Volatility indicators suggest a sideways movement in the stock price.
Volume Analysis:
- On-Balance Volume (OBV): The OBV values have been fluctuating, indicating mixed buying and selling pressure.
- Chaikin Money Flow (CMF): The CMF values have been positive but not significantly strong.
Key Observation: Volume indicators reflect mixed sentiment in the market.
Conclusion:
Based on the analysis of trend, momentum, volatility, and volume indicators, the overall outlook for EMXC in the next few days is as follows: - Trend: Upward - Momentum: Neutral to slightly bearish - Volatility: Sideways - Volume: Mixed sentiment
Final Verdict:
Considering the mixed signals from momentum and volume indicators, alongside the stable volatility and bullish trend, it is likely that EMXC will experience consolidation in the near term. Traders should exercise caution and closely monitor key support and resistance levels for potential entry or exit points.