Technical Analysis of EMXF 2024-05-10
Overview:
In analyzing the technical indicators for EMXF over the last 5 days, we will delve into the trend, momentum, volatility, and volume indicators to provide a comprehensive outlook on the possible stock price movement. By examining these key aspects, we aim to offer valuable insights and predictions for the upcoming trading days.
Trend Analysis:
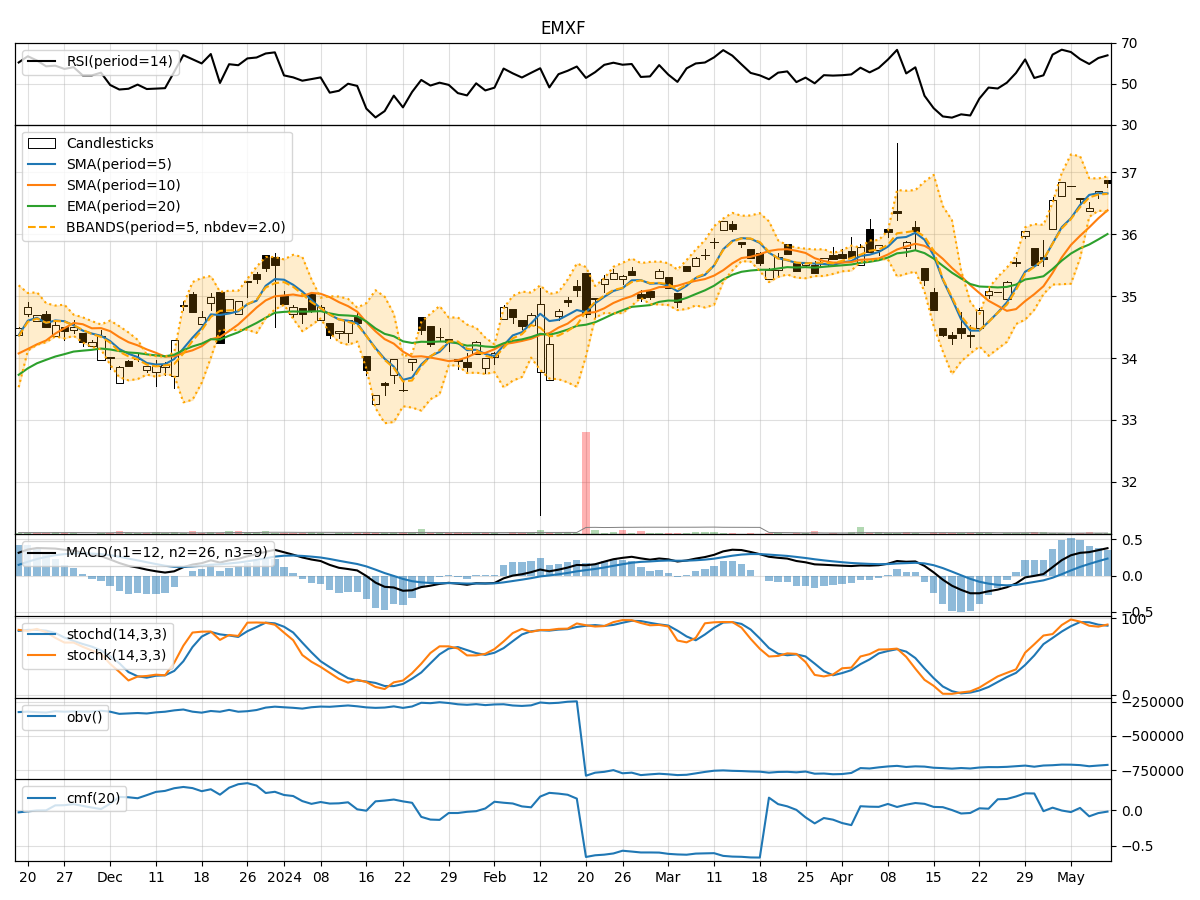
- Moving Averages (MA): The 5-day Moving Average (MA) has been consistently above the Simple Moving Average (SMA) and Exponential Moving Average (EMA), indicating a bullish trend.
- MACD: The MACD line has been above the signal line, with both lines showing an upward trend, suggesting positive momentum in the stock price.
Momentum Analysis:
- RSI: The Relative Strength Index (RSI) has been fluctuating around the 60-70 range, indicating a neutral momentum in the stock.
- Stochastic Oscillator: The Stochastic Oscillator shows values close to the overbought region, suggesting a potential reversal or consolidation phase.
Volatility Analysis:
- Bollinger Bands (BB): The Bollinger Bands have been relatively narrow, indicating low volatility in the stock price movement.
Volume Analysis:
- On-Balance Volume (OBV): The OBV has been declining over the last 5 days, indicating a decrease in buying pressure.
- Chaikin Money Flow (CMF): The CMF has been negative, suggesting a lack of buying interest in the stock.
Key Observations:
- The trend indicators suggest a bullish sentiment in the stock price.
- Momentum indicators show a neutral stance with a potential for a reversal.
- Volatility remains low, indicating a stable price movement.
- Volume indicators point towards a decrease in buying pressure.
Conclusion:
Based on the analysis of the technical indicators, the next few days for EMXF stock price movement could see sideways consolidation with a slight bearish bias. Traders should exercise caution and monitor the Stochastic Oscillator for potential reversal signals. Additionally, keeping an eye on the OBV and CMF for any shifts in buying pressure would be crucial in determining the stock's future direction.