Technical Analysis of ENZL 2024-05-10
Overview:
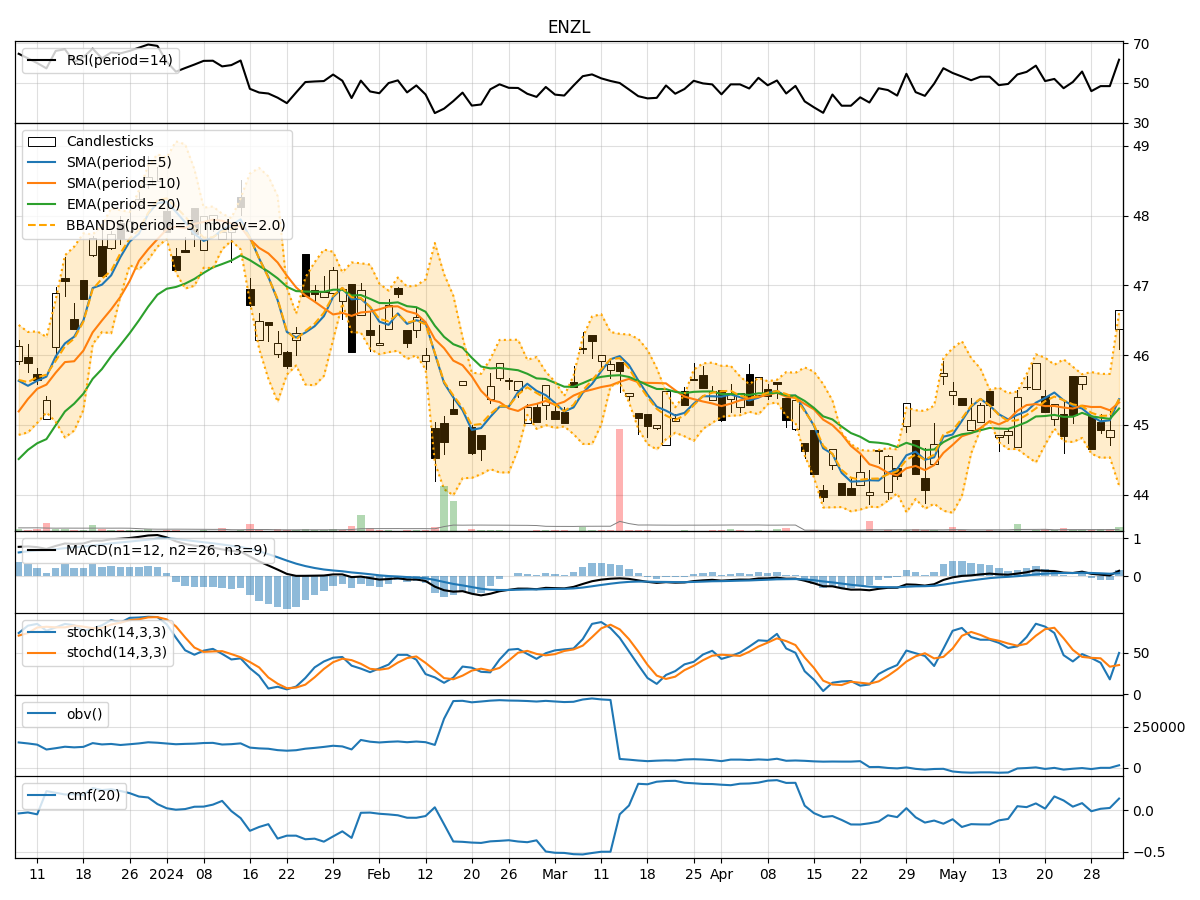
In analyzing the technical indicators for ENZL over the last 5 days, we will delve into the trend, momentum, volatility, and volume indicators to provide a comprehensive outlook on the possible stock price movement. By examining these key aspects, we aim to offer valuable insights and predictions for the upcoming trading days.
Trend Analysis:
- Moving Averages (MA): The 5-day Moving Average (MA) has been consistently above the Simple Moving Average (SMA) and Exponential Moving Average (EMA), indicating a bullish trend.
- MACD: The MACD line has been consistently above the signal line, with both lines showing an upward trend, suggesting bullish momentum.
- RSI: The Relative Strength Index (RSI) has been fluctuating around the 50 level, indicating a neutral stance in terms of momentum.
Momentum Analysis:
- Stochastic Oscillator: The Stochastic Oscillator has been hovering around the overbought territory, suggesting a potential reversal or consolidation in the near term.
- Williams %R: The Williams %R indicator has been fluctuating around the oversold region, indicating a mixed sentiment among traders.
Volatility Analysis:
- Bollinger Bands: The Bollinger Bands have been narrowing, indicating decreasing volatility in the stock price.
- Average True Range (ATR): The ATR has been relatively stable, suggesting a lack of significant price movements.
Volume Analysis:
- On-Balance Volume (OBV): The OBV has been showing a slight decline, indicating a decrease in buying pressure.
- Chaikin Money Flow (CMF): The CMF has been negative, signaling a bearish sentiment in terms of money flow.
Conclusion:
Based on the analysis of the technical indicators, the stock price of ENZL is likely to experience sideways movement in the next few days. The bullish trend indicated by the moving averages and MACD may be offset by the overbought signals from the Stochastic Oscillator and the negative money flow indicated by the CMF. Additionally, the narrowing Bollinger Bands and stable ATR suggest a lack of significant price movements in the near term. Traders should exercise caution and closely monitor key support and resistance levels for potential trading opportunities.