Technical Analysis of EOCT 2024-05-10
Overview:
In analyzing the technical indicators for the last 5 days, we will delve into the trend, momentum, volatility, and volume indicators to provide insights into the possible stock price movement for the next few days. By examining these indicators, we aim to offer a comprehensive and data-driven prediction for the stock's future direction.
Trend Indicators:
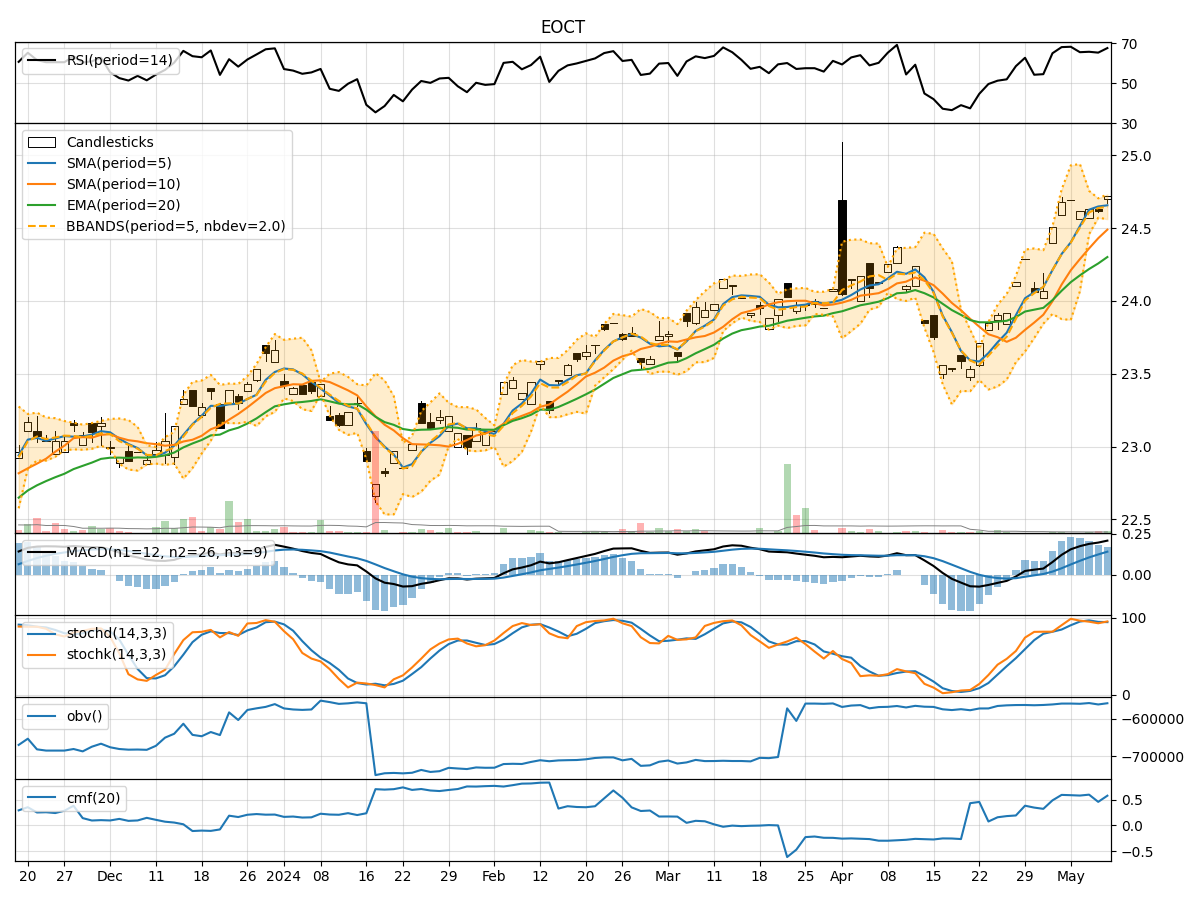
- Moving Averages (MA): The 5-day moving average has been consistently above the closing price, indicating a bullish trend.
- MACD: The MACD line has been above the signal line for the past 5 days, suggesting positive momentum.
- RSI: The Relative Strength Index has been fluctuating around the overbought territory, indicating strong buying pressure.
Momentum Indicators:
- Stochastic Oscillator: Both %K and %D have been in the overbought zone, signaling a potential reversal.
- Williams %R: The Williams %R has been hovering around oversold levels, suggesting a possible buying opportunity.
Volatility Indicators:
- Bollinger Bands: The stock price has been trading within the bands, indicating a period of consolidation.
- Average True Range (ATR): The ATR has been relatively stable, suggesting consistent price movements.
Volume Indicators:
- On-Balance Volume (OBV): The OBV has shown mixed signals, reflecting indecision among market participants.
- Chaikin Money Flow (CMF): The CMF has been positive, indicating buying pressure in the market.
Key Observations:
- The trend indicators suggest a bullish sentiment in the short term.
- Momentum indicators show signs of potential reversal or consolidation.
- Volatility indicators point towards a period of stability and consolidation.
- Volume indicators indicate mixed signals with a slight bias towards buying pressure.
Conclusion:
Based on the analysis of the technical indicators, the stock is likely to experience sideways movement in the next few days, with a potential for consolidation. Traders should exercise caution and closely monitor key support and resistance levels for potential breakout opportunities. It is advisable to wait for clearer signals from the momentum and volume indicators before making significant trading decisions.