Technical Analysis of EPP 2024-05-10
Overview:
In analyzing the technical indicators for EPP stock over the last 5 days, we will delve into the trend, momentum, volatility, and volume indicators to provide a comprehensive outlook on the possible stock price movement in the coming days. By examining these key indicators, we aim to offer valuable insights and predictions to guide your investment decisions.
Trend Analysis:
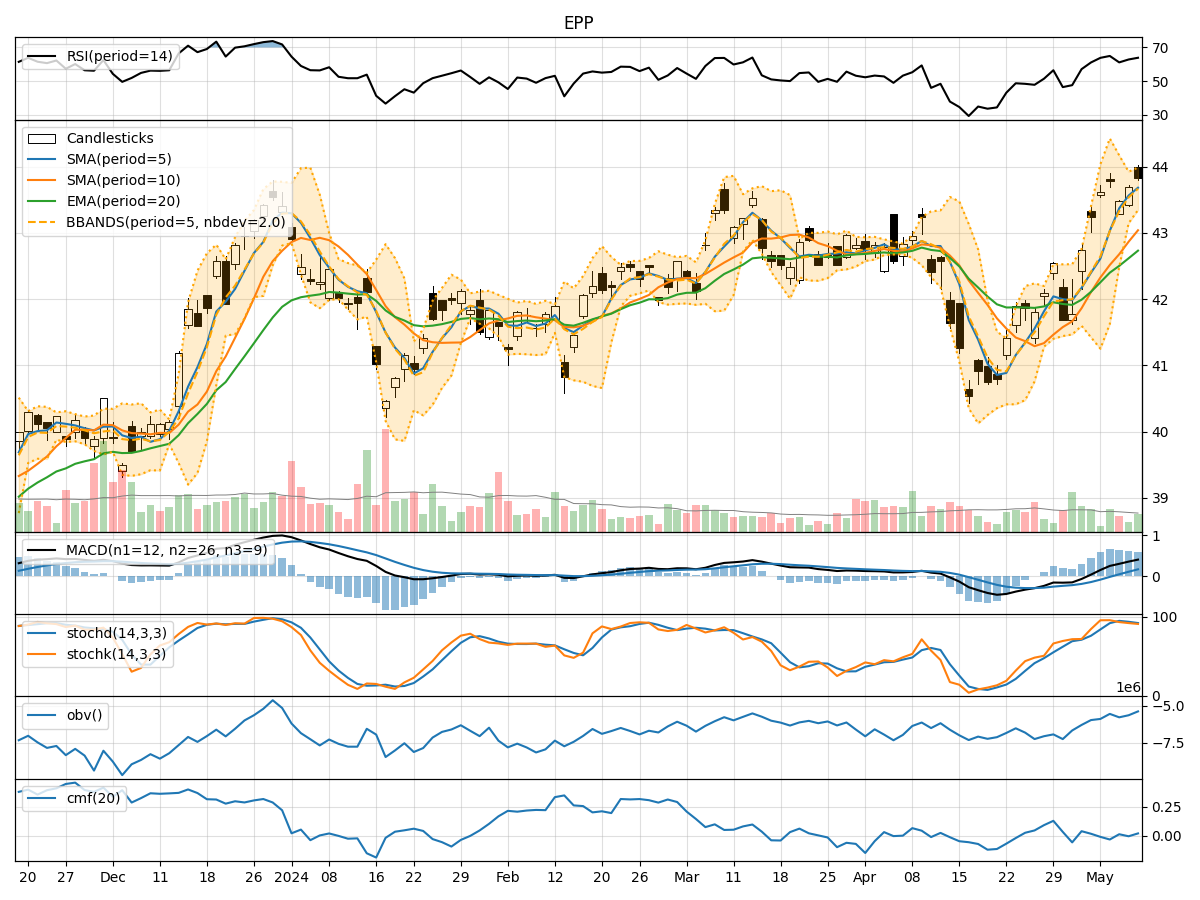
- Moving Averages (MA): The 5-day Moving Average (MA) has been consistently above the Simple Moving Average (SMA) and Exponential Moving Average (EMA), indicating a bullish trend.
- MACD: The MACD line has been consistently above the signal line, suggesting a bullish momentum in the stock price.
- Conclusion: The trend indicators point towards an upward trend in the stock price.
Momentum Analysis:
- RSI: The Relative Strength Index (RSI) has been hovering around 60-65, indicating a neutral momentum in the stock.
- Stochastic Oscillator: Both %K and %D have been gradually decreasing but remain in the overbought territory.
- Conclusion: The momentum indicators suggest a neutral stance with a slight bearish bias.
Volatility Analysis:
- Bollinger Bands (BB): The stock price has been trading within the upper Bollinger Band (BBU), indicating increased volatility.
- Conclusion: The volatility indicators signal an increased volatility in the stock price.
Volume Analysis:
- On-Balance Volume (OBV): The OBV has shown mixed movements over the last 5 days, indicating indecision among investors.
- Chaikin Money Flow (CMF): The CMF has been fluctuating around the zero line, reflecting a lack of strong buying or selling pressure.
- Conclusion: The volume indicators suggest a lack of clear direction in investor sentiment.
Overall Conclusion:
Based on the analysis of the trend, momentum, volatility, and volume indicators, the following conclusions can be drawn: - The trend indicators point towards an upward trend in the stock price. - Momentum indicators suggest a neutral stance with a slight bearish bias. - Volatility indicators signal an increased volatility in the stock price. - Volume indicators indicate a lack of clear direction in investor sentiment.
Future Price Movement Prediction:
Considering the overall analysis, it is likely that the stock price of EPP may experience increased volatility in the coming days, potentially leading to sideways movement with a slight bearish bias in the short term. Investors should closely monitor key support and resistance levels to make informed trading decisions.
In conclusion, while the trend remains bullish, the mixed signals from momentum, volatility, and volume indicators suggest a period of consolidation or sideways movement in the near future. It is essential for investors to exercise caution and closely monitor the evolving market dynamics to capitalize on potential trading opportunities.