Technical Analysis of EPRF 2024-05-10
Overview:
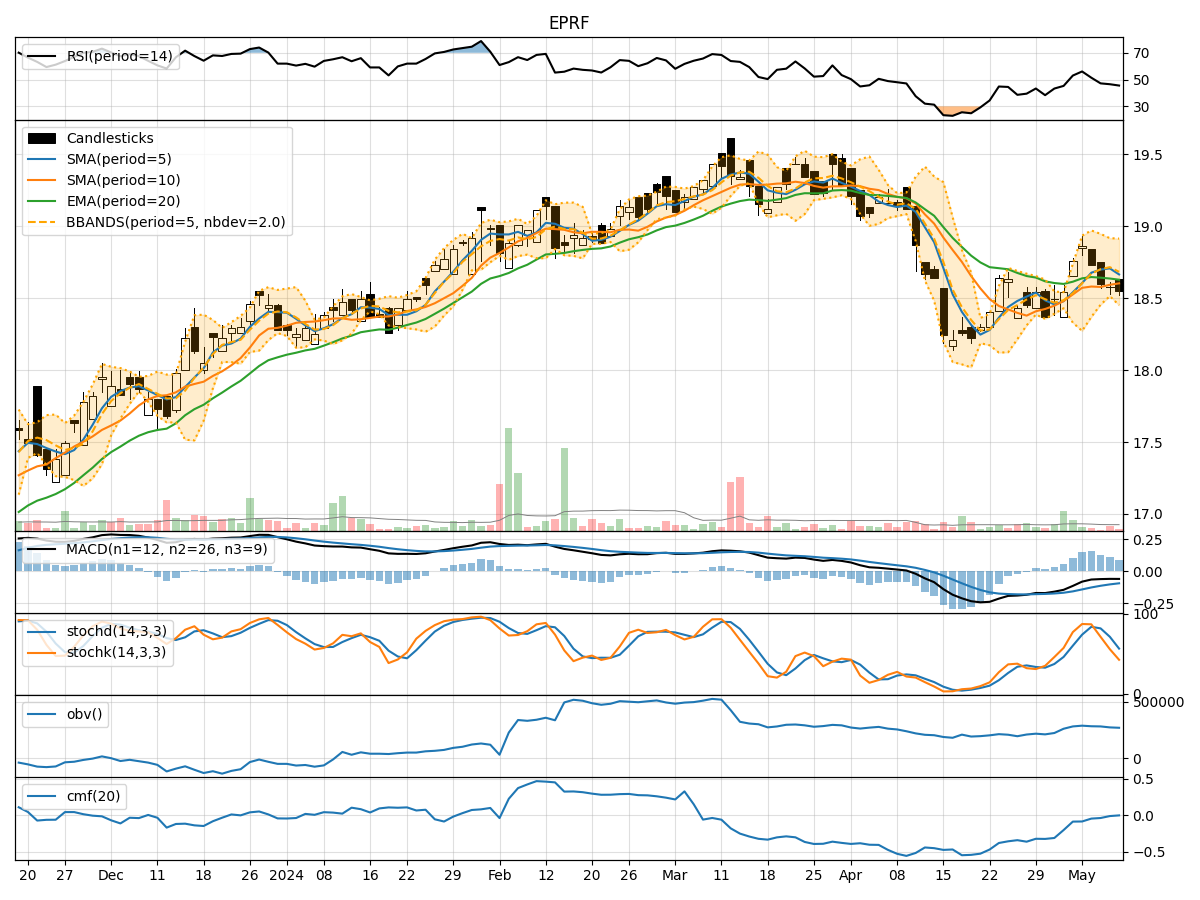
In the last 5 trading days, EPRF stock has shown a slight decline in price from 18.86 to 18.55. Various technical indicators have been analyzed to provide insights into the potential future price movement of the stock. The analysis covers trend indicators, momentum indicators, volatility indicators, and volume indicators.
Trend Indicators:
- Moving averages (MA) show a slight decrease over the last 5 days, indicating a short-term bearish trend.
- MACD and MACD Histogram are negative, suggesting a bearish momentum.
- Overall, the trend indicators point towards a bearish sentiment in the short term.
Momentum Indicators:
- RSI has been decreasing, indicating weakening momentum.
- Stochastic oscillators are also trending downwards, showing a loss in buying pressure.
- Williams %R is in the oversold territory, suggesting a potential reversal.
- Momentum indicators signal a bearish sentiment in the short term.
Volatility Indicators:
- Bollinger Bands are narrowing, indicating decreasing volatility.
- The stock price is currently trading close to the lower Bollinger Band, suggesting a possible oversold condition.
- Volatility indicators imply a sideways movement or a potential bullish reversal.
Volume Indicators:
- On-Balance Volume (OBV) has been negative, indicating distribution.
- Chaikin Money Flow (CMF) is also negative, showing selling pressure.
- Volume indicators suggest a bearish sentiment in the short term.
Conclusion:
Based on the analysis of trend, momentum, volatility, and volume indicators, the overall outlook for EPRF stock in the next few days is bearish. The trend is downward, momentum is weakening, and volume indicators confirm selling pressure. However, the narrowing Bollinger Bands and oversold Williams %R signal a possible bullish reversal or a period of consolidation in the near future. Traders should exercise caution and closely monitor key support and resistance levels for potential entry or exit points.
Key Points:
- Trend: Bearish
- Momentum: Bearish
- Volatility: Sideways/Bullish Reversal
- Volume: Bearish
- Overall: Bearish with potential for a bullish reversal or consolidation
It is crucial to combine technical analysis with fundamental research and market sentiment to make well-informed trading decisions. Stay vigilant and adapt to changing market conditions to optimize your trading strategies.