Technical Analysis of EPS 2024-05-10
Overview:
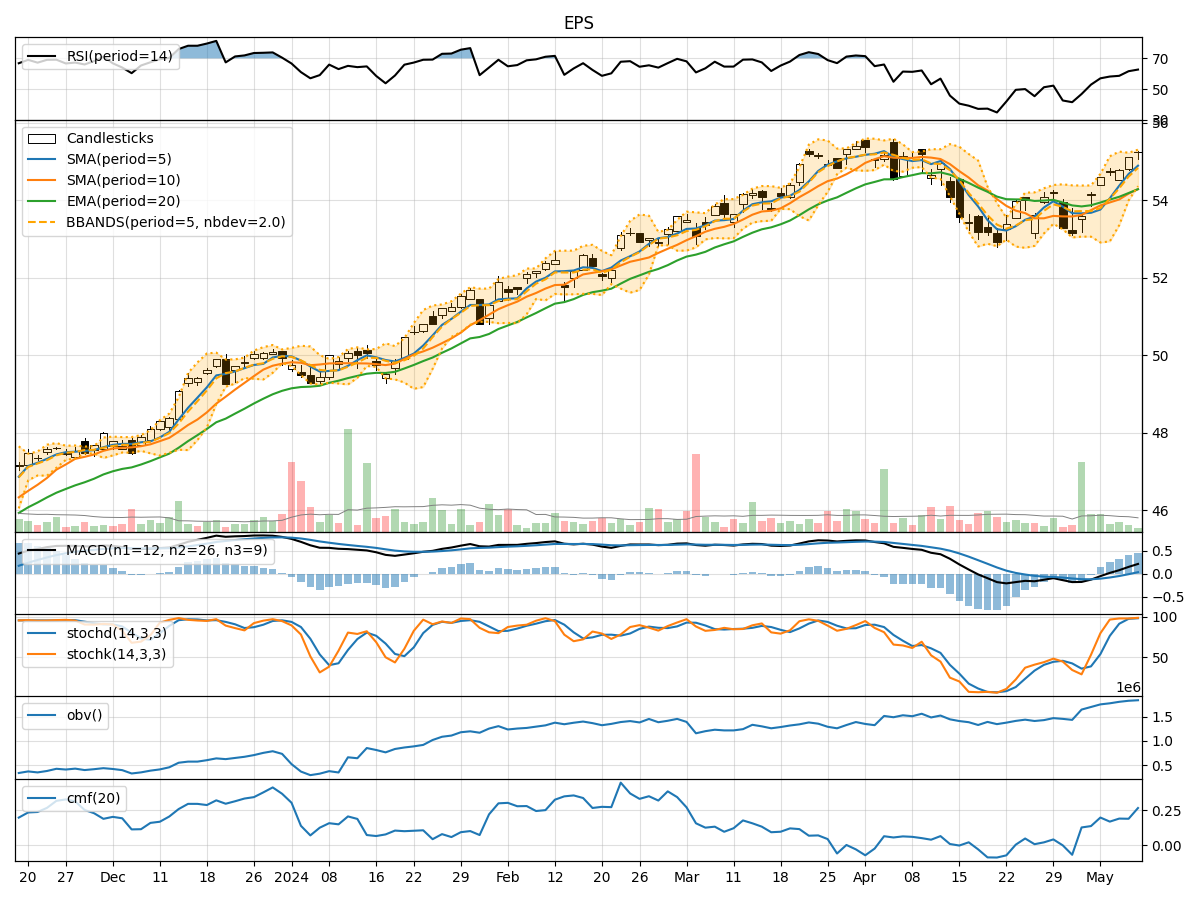
In analyzing the technical indicators for the last 5 days, we will delve into the trend, momentum, volatility, and volume indicators to forecast the possible stock price movement for the next few days. By examining these key aspects, we aim to provide a comprehensive and insightful prediction backed by data-driven analysis.
Trend Indicators:
- Moving Averages (MA): The 5-day moving average has been consistently rising, indicating a bullish trend in the short term.
- MACD: The MACD line has been above the signal line for the past few days, suggesting positive momentum.
- EMA: The exponential moving average has also been trending upwards, supporting the bullish sentiment.
Momentum Indicators:
- RSI: The Relative Strength Index has been increasing, showing strengthening momentum.
- Stochastic Oscillator: Both %K and %D have been in the overbought territory, signaling a potential reversal or consolidation.
- Williams %R: The Williams %R is in the oversold region, indicating a possible buying opportunity.
Volatility Indicators:
- Bollinger Bands: The stock price has been trading within the upper Bollinger Band, indicating high volatility.
- Bollinger Band Width: The band width has been narrowing, suggesting a potential decrease in volatility.
- Bollinger Band %B: The %B indicator is above 0.8, signifying an overbought condition.
Volume Indicators:
- On-Balance Volume (OBV): The OBV has been steadily increasing, indicating accumulation by investors.
- Chaikin Money Flow (CMF): The CMF has been positive, reflecting buying pressure in the market.
Key Observations and Opinions:
- Trend: The trend indicators suggest a bullish sentiment in the short term.
- Momentum: Momentum indicators show a mix of overbought and oversold conditions, hinting at a potential reversal or consolidation.
- Volatility: Volatility has been high but might be decreasing based on the narrowing Bollinger Bands.
- Volume: Accumulation is evident from the rising OBV and positive CMF.
Conclusion:
Based on the analysis of the technical indicators, the stock is likely to experience further upward movement in the next few days. The bullish trend, positive momentum, and accumulation by investors indicate a favorable outlook. However, caution is advised as some momentum indicators suggest potential overbought conditions, which could lead to a short-term pullback or consolidation. Overall, the stock is poised for continued bullish momentum in the near future.