Technical Analysis of EPV 2024-05-10
Overview:
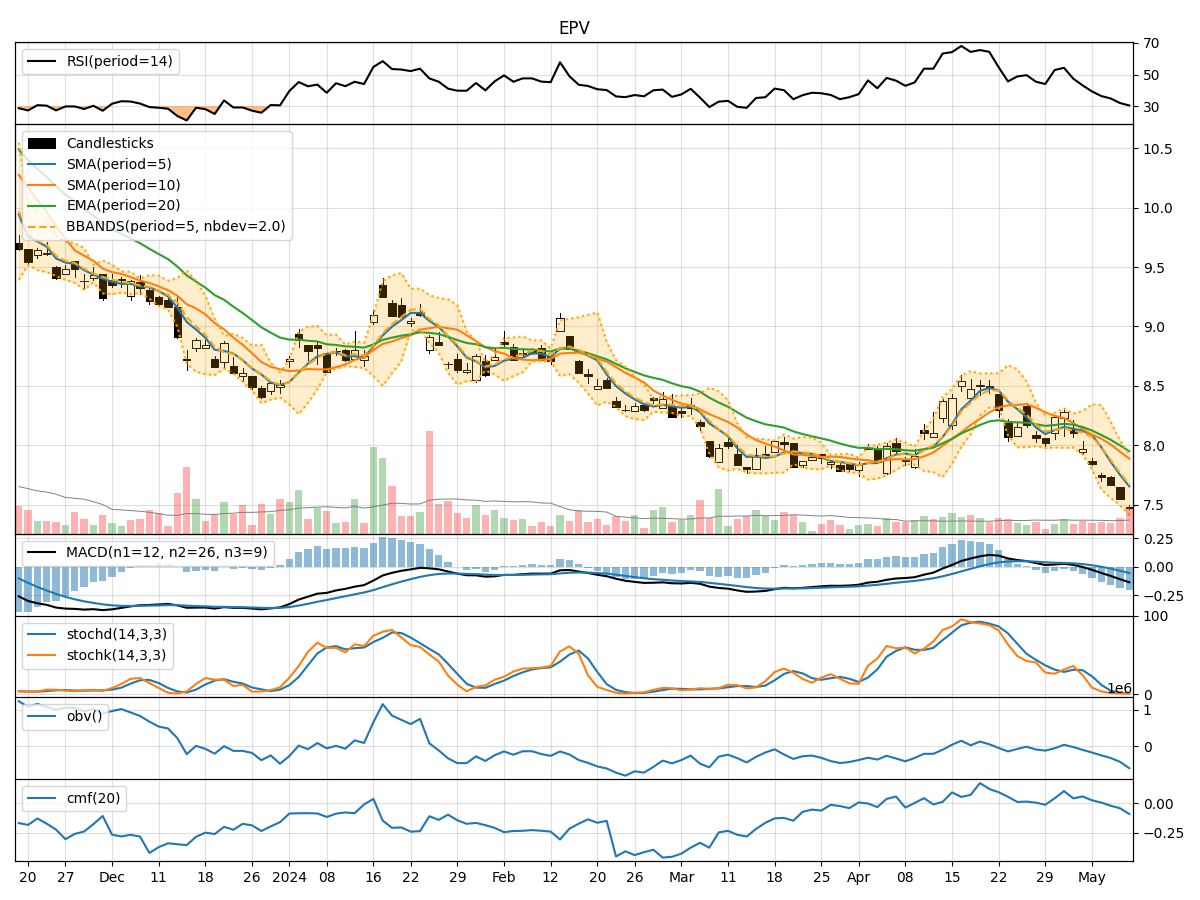
In analyzing the technical indicators for EPV stock over the last 5 days, we will delve into the trends, momentum, volatility, and volume aspects to provide a comprehensive outlook on the possible stock price movement in the coming days. By examining key indicators such as moving averages, MACD, RSI, Bollinger Bands, and OBV, we aim to offer valuable insights and predictions for potential price action.
Trend Analysis:
- Moving Averages (MA): The 5-day MA has been consistently below the closing prices, indicating a downward trend.
- MACD: The MACD line has been negative and decreasing, suggesting bearish momentum.
Momentum Analysis:
- RSI: The RSI has been declining and is currently in the oversold territory, signaling potential weakness in the stock.
- Stochastic Oscillator: Both %K and %D are at extremely low levels, indicating strong bearish momentum.
Volatility Analysis:
- Bollinger Bands (BB): The stock price has been consistently below the middle Bollinger Band, indicating a downtrend with low volatility.
Volume Analysis:
- On-Balance Volume (OBV): The OBV has been consistently decreasing, reflecting selling pressure and bearish sentiment.
Key Observations:
- The stock is in a clear downtrend based on moving averages and MACD.
- Momentum indicators like RSI and Stochastic Oscillator suggest strong bearish momentum.
- Volatility is low, as indicated by Bollinger Bands, which may lead to sideways or consolidation price movement.
- The declining OBV points towards increased selling volume and negative market sentiment.
Conclusion:
Based on the analysis of technical indicators, the next few days' possible stock price movement for EPV is likely to be bearish. The stock is expected to continue its downward trend, driven by strong bearish momentum and selling pressure. Traders and investors should exercise caution and consider shorting or staying on the sidelines until there are signs of a reversal in the technical indicators.