Technical Analysis of EQAL 2024-05-10
Overview:
In analyzing the technical indicators for EQAL stock over the last 5 days, we will delve into the trend, momentum, volatility, and volume indicators to provide a comprehensive outlook on the possible stock price movement in the coming days. By examining these key indicators, we aim to offer valuable insights and predictions for potential investors.
Trend Analysis:
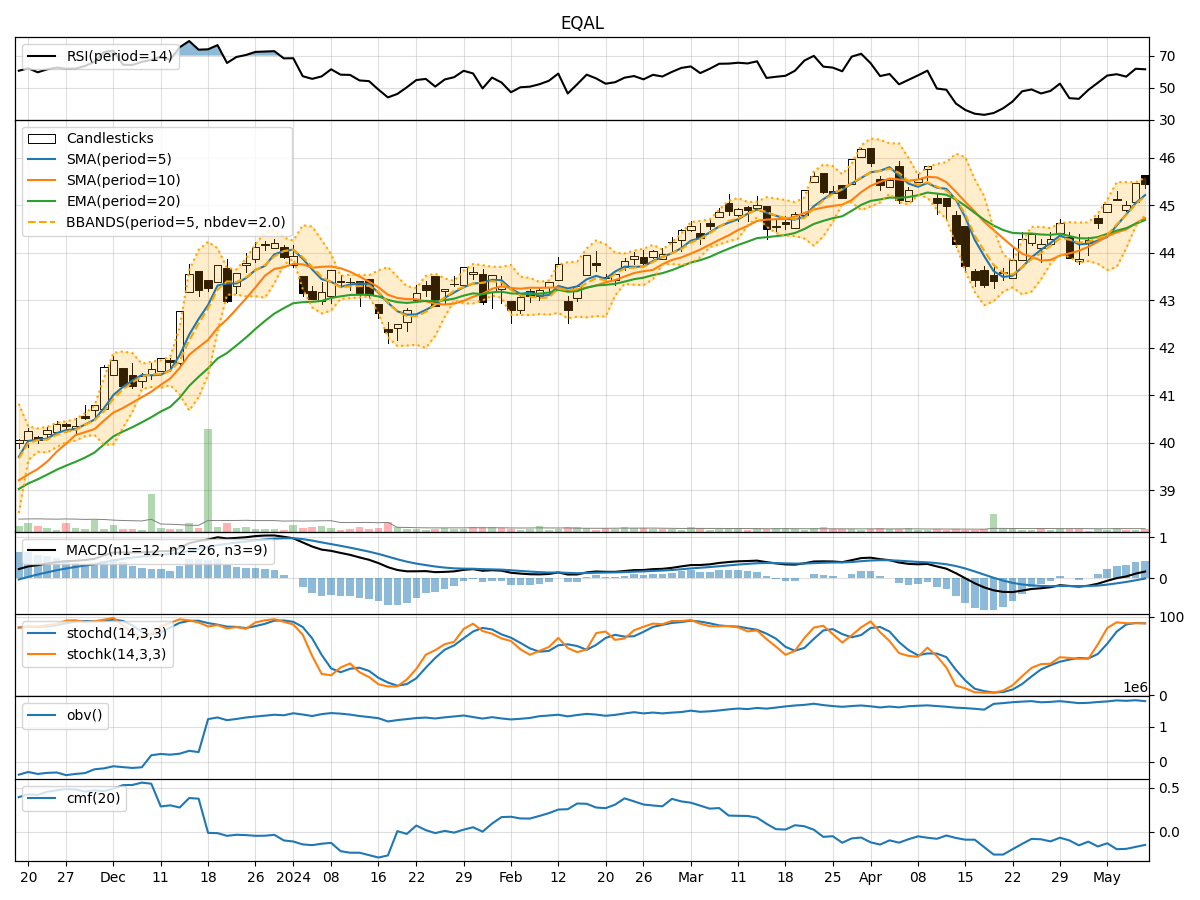
- Moving Averages (MA): The 5-day MA has been consistently above the closing prices, indicating a bullish trend.
- MACD: The MACD line has been above the signal line for the past 5 days, suggesting a bullish momentum.
- RSI: The RSI values have been fluctuating but generally above 50, indicating a bullish sentiment.
Key Observation: The trend indicators suggest a bullish outlook for EQAL stock.
Momentum Analysis:
- Stochastic Oscillator: Both %K and %D values have been relatively high, indicating strong buying momentum.
- Williams %R: The values have been mostly negative, suggesting an oversold condition.
Key Observation: Momentum indicators point towards a bullish sentiment with potential buying opportunities.
Volatility Analysis:
- Bollinger Bands (BB): The stock price has mostly remained within the bands, indicating moderate volatility.
- Bollinger %B: The %B values have fluctuated but generally within the normal range.
Key Observation: Volatility indicators suggest a stable price movement with no extreme fluctuations.
Volume Analysis:
- On-Balance Volume (OBV): The OBV values have shown slight fluctuations but have not diverged significantly from the price movement.
- Chaikin Money Flow (CMF): The CMF values have been negative, indicating some selling pressure.
Key Observation: Volume indicators suggest a neutral to slightly bearish sentiment due to the negative CMF values.
Conclusion:
Based on the analysis of trend, momentum, volatility, and volume indicators, the overall outlook for EQAL stock in the next few days is bullish. The trend indicators, momentum signals, and moderate volatility levels all point towards a potential upward movement in the stock price. However, the slightly negative volume indicators suggest a cautious approach, as there might be some selling pressure in the market.
Key Conclusion: The stock is likely to experience an upward movement in the coming days, but investors should monitor the volume closely for any signs of a trend reversal.