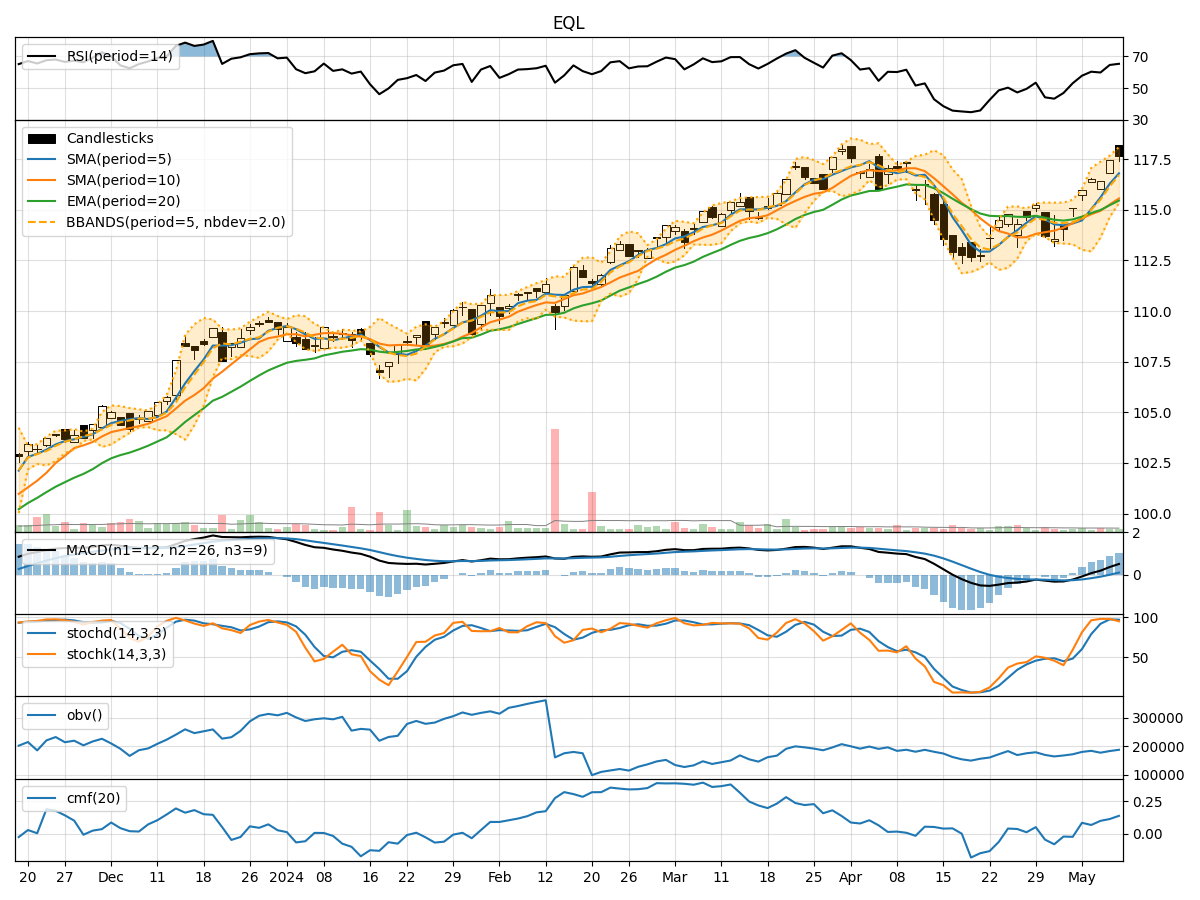
Technical Analysis of EQL 2024-05-10
Overview:
In analyzing the technical indicators for EQL over the last 5 days, we will delve into the trend, momentum, volatility, and volume indicators to provide a comprehensive outlook on the possible stock price movement in the coming days. By examining these key aspects, we aim to offer valuable insights and recommendations for your investment decisions.
Trend Analysis:
- Moving Averages (MA): The 5-day MA has been consistently trending upwards, indicating a positive momentum in the stock price.
- MACD: The MACD line has been above the signal line for the past few days, suggesting a bullish trend.
- Relative Strength Index (RSI): The RSI has been in the range of 50-70, indicating a moderate bullish sentiment.
Momentum Analysis:
- Stochastic Oscillator: The Stochastic Oscillator has been in the overbought zone, suggesting a potential reversal or consolidation.
- Williams %R (WillR): The WillR indicator has shown oversold conditions on the last trading day, signaling a possible reversal.
Volatility Analysis:
- Bollinger Bands (BB): The Bollinger Bands have been narrowing, indicating decreasing volatility in the stock price.
- Bollinger Band %B (BBP): The %B indicator has been hovering around 0.8, suggesting a relatively high price compared to the upper band.
Volume Analysis:
- On-Balance Volume (OBV): The OBV has shown a slight decrease over the last few days, indicating some selling pressure.
- Chaikin Money Flow (CMF): The CMF has been positive, reflecting buying pressure in the stock.
Key Observations:
- The trend indicators suggest a bullish sentiment with the moving averages and MACD supporting an upward trend.
- Momentum indicators show a potential reversal or consolidation as the Stochastic Oscillator and Williams %R indicate overbought and oversold conditions, respectively.
- Volatility indicators point towards decreasing volatility, which could lead to a period of consolidation.
- Volume indicators reflect a slight decrease in buying pressure but overall positive sentiment with the CMF.
Conclusion:
Based on the analysis of the technical indicators, the stock price of EQL is likely to experience a short-term consolidation or sideways movement in the coming days. The bullish trend indicated by the moving averages and MACD may face resistance due to overbought conditions highlighted by the momentum indicators. The decreasing volatility suggests a period of stability, while the volume indicators indicate a balanced buying pressure. Therefore, it is recommended to exercise caution and closely monitor the price action for potential entry or exit points.