Technical Analysis of EQTY 2024-05-10
Overview:
In analyzing the technical indicators for the stock EQTY over the last 5 days, we will delve into the trends, momentum, volatility, and volume indicators to provide a comprehensive outlook on the possible stock price movement in the coming days. By examining these key indicators, we aim to offer valuable insights and recommendations for potential investors.
Trend Analysis:
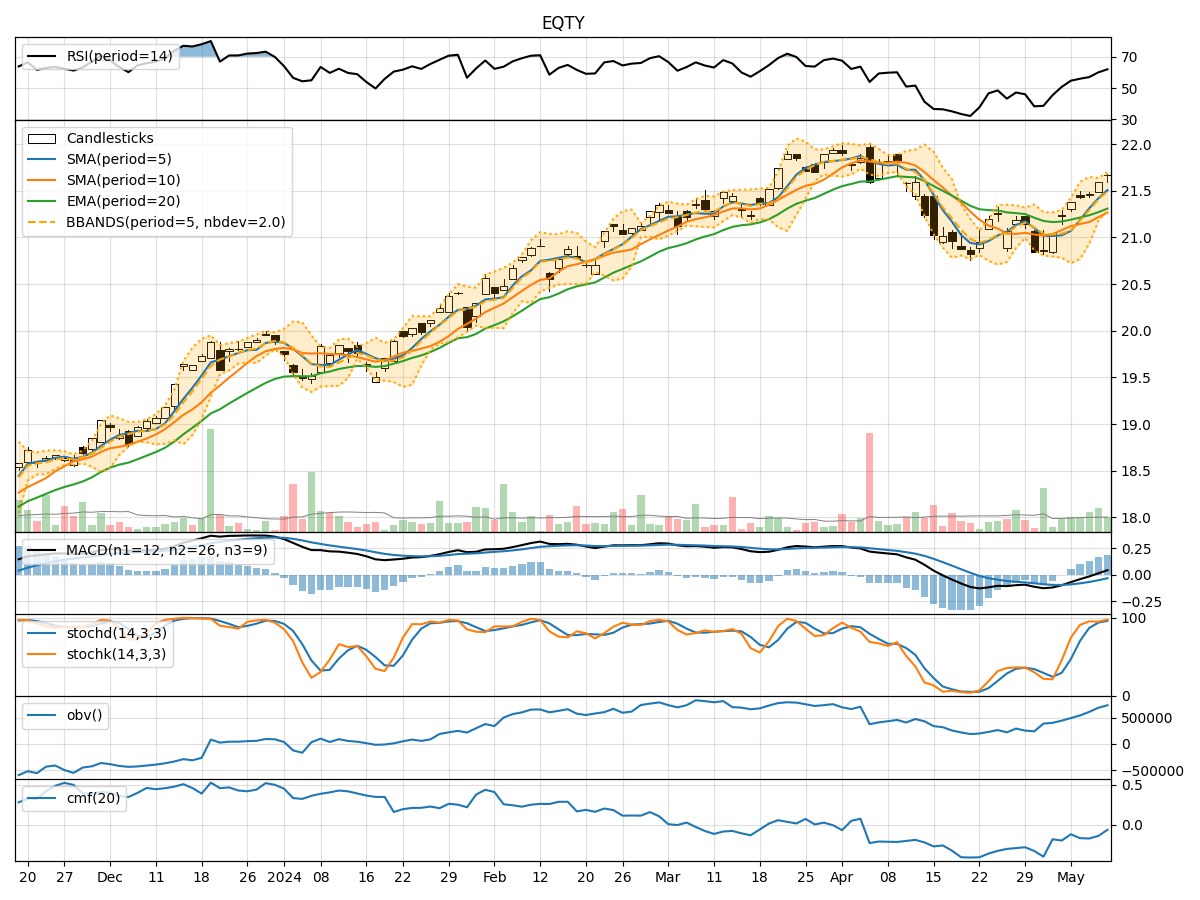
- Moving Averages (MA): The 5-day Moving Average (MA) has been consistently above the Simple Moving Average (SMA) and Exponential Moving Average (EMA), indicating a bullish trend.
- MACD: The Moving Average Convergence Divergence (MACD) has shown positive values, with the MACD line consistently above the Signal line, suggesting bullish momentum.
- Conclusion: The trend indicators point towards an upward trend in the stock price.
Momentum Analysis:
- RSI: The Relative Strength Index (RSI) has been increasing over the past 5 days, indicating strengthening momentum.
- Stochastic Oscillator: Both %K and %D values have been in the overbought territory, suggesting a strong bullish momentum.
- Conclusion: Momentum indicators signal a bullish sentiment in the stock.
Volatility Analysis:
- Bollinger Bands (BB): The stock price has been trading within the Bollinger Bands, with the bands narrowing, indicating decreasing volatility.
- Conclusion: Volatility indicators suggest a consolidation phase in the stock price.
Volume Analysis:
- On-Balance Volume (OBV): The OBV has shown mixed signals, with fluctuations in volume accumulation.
- Chaikin Money Flow (CMF): The CMF has been negative, indicating selling pressure in the stock.
- Conclusion: Volume indicators reflect a neutral to slightly bearish sentiment.
Overall Conclusion:
Based on the analysis of trend, momentum, volatility, and volume indicators, the overall outlook for EQTY stock suggests a bullish trend in the short term. The positive trend and momentum indicators, coupled with decreasing volatility, indicate a potential for further price appreciation. However, the mixed signals from volume indicators warrant caution, as selling pressure may impact the stock price.
Recommendation:
Considering the overall bullish sentiment in the trend and momentum indicators, investors may consider buying EQTY stock for potential short-term gains. It is essential to monitor volume trends closely to gauge market sentiment accurately. Additionally, setting appropriate stop-loss levels to manage risk is advisable in volatile market conditions.
Disclaimer:
This analysis is based solely on technical indicators and historical data, and it is essential to conduct thorough research and consider fundamental factors before making investment decisions. Market dynamics can change rapidly, impacting stock prices unpredictably. Consult with a financial advisor for personalized investment advice tailored to your risk tolerance and financial goals.