Technical Analysis of ERET 2024-05-10
Overview:
In the last 5 trading days, the stock price of ERET has shown some fluctuations with a mix of bullish and bearish signals across various technical indicators. By analyzing the trend, momentum, volatility, and volume indicators, we can gain insights into the possible future price movement of ERET stock.
Trend Indicators Analysis:
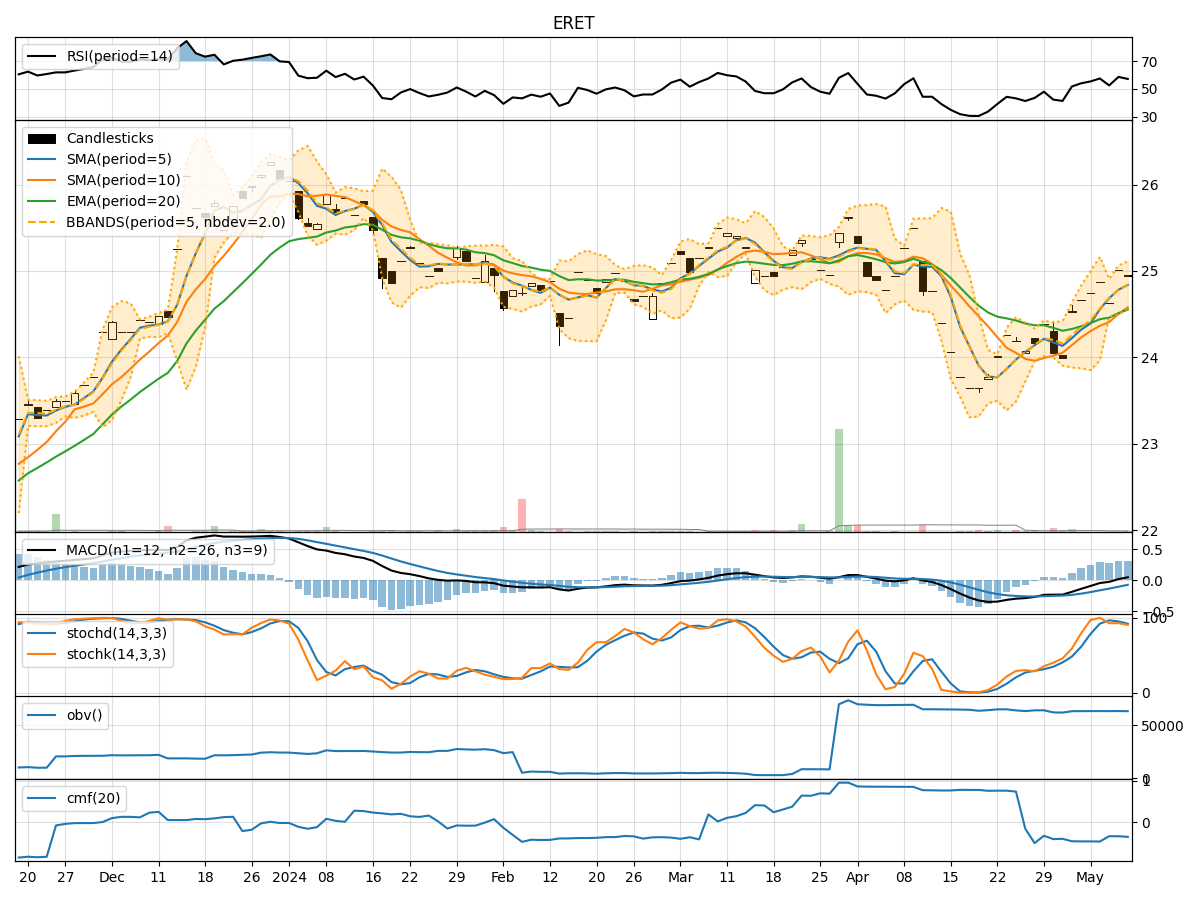
- Moving Averages (MA): The 5-day Moving Average (MA) has been above the Simple Moving Average (SMA) and Exponential Moving Average (EMA), indicating a short-term bullish trend.
- MACD: The MACD line has been consistently above the signal line, suggesting bullish momentum.
- MACD Histogram: The MACD Histogram has been positive, indicating increasing bullish momentum.
Momentum Indicators Analysis:
- RSI: The Relative Strength Index (RSI) has been fluctuating around the 50 level, indicating a neutral momentum.
- Stochastic Oscillator: The Stochastic Oscillator has been in the overbought region, suggesting a potential reversal in the short term.
- Williams %R: The Williams %R has been fluctuating around the oversold region, indicating potential buying opportunities.
Volatility Indicators Analysis:
- Bollinger Bands: The Bollinger Bands have been relatively narrow, suggesting low volatility in the stock price.
- Bollinger %B: The Bollinger %B has been hovering around the middle, indicating a balanced market sentiment.
Volume Indicators Analysis:
- On-Balance Volume (OBV): The OBV has shown a slight decrease, indicating some distribution of the stock.
- Chaikin Money Flow (CMF): The CMF has been negative, suggesting a bearish money flow in the stock.
Key Observations:
- The trend indicators suggest a short-term bullish bias in the stock price.
- Momentum indicators show mixed signals with a neutral to slightly bearish outlook.
- Volatility indicators indicate low volatility and a balanced market sentiment.
- Volume indicators point towards a slight distribution of the stock and bearish money flow.
Conclusion:
Based on the analysis of the technical indicators, the next few days' possible stock price movement for ERET is likely to be sideways with a slight bearish bias. Traders should exercise caution and closely monitor key support and resistance levels for potential entry and exit points. It is advisable to wait for more confirmation from the indicators before taking significant trading positions.