Technical Analysis of ESG 2024-05-10
Overview:
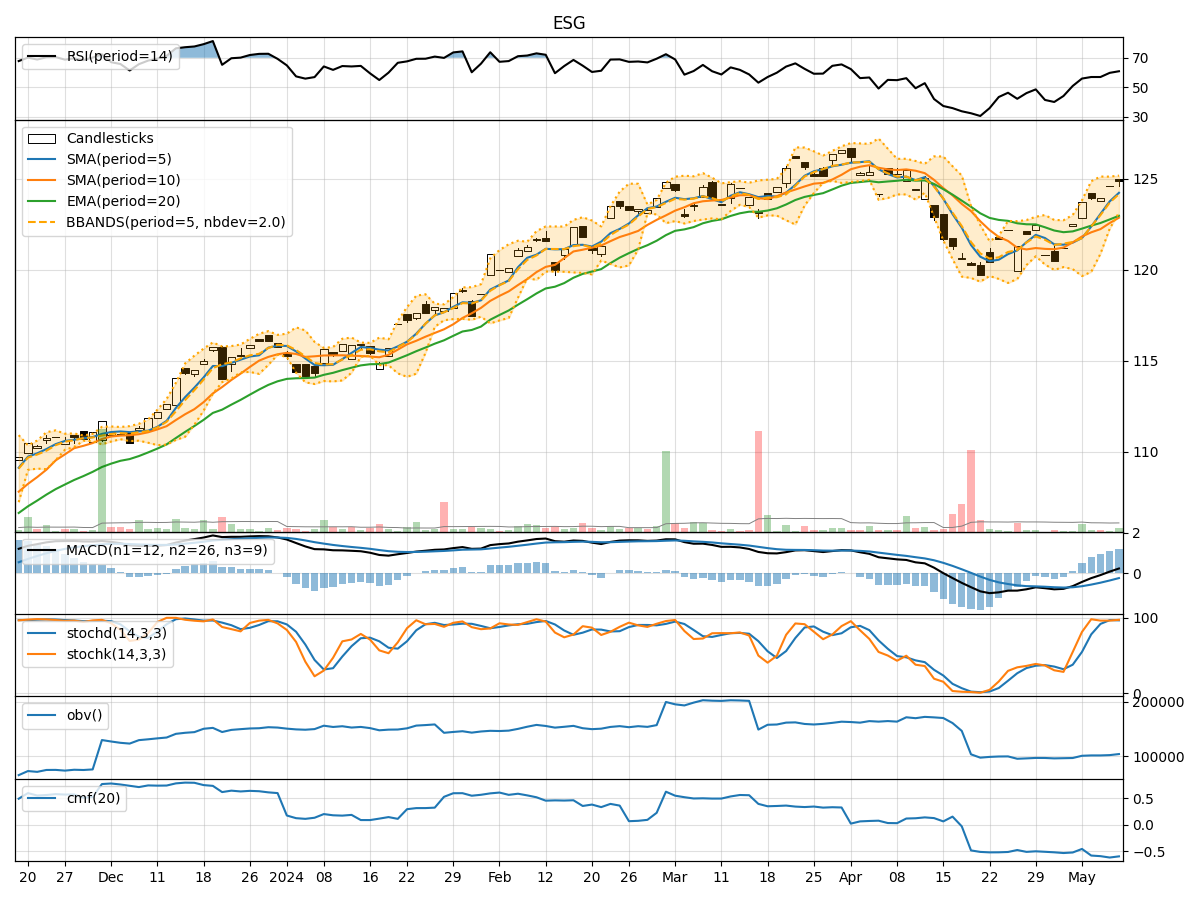
In the last 5 trading days, the stock price has shown a gradual increase, with the closing price rising from 123.70 to 124.88. Various technical indicators have been analyzed to provide insights into the potential future movement of the stock price. The trend indicators, momentum indicators, volatility indicators, and volume indicators have been considered to form a comprehensive analysis.
Trend Indicators:
- Moving Averages (MA): The 5-day Moving Average (MA) has been consistently above the Simple Moving Average (SMA) and Exponential Moving Average (EMA), indicating a bullish trend.
- MACD: The MACD line has been consistently above the signal line, suggesting a bullish momentum in the stock price.
- RSI: The Relative Strength Index (RSI) has been increasing, indicating strengthening bullish momentum.
Momentum Indicators:
- Stochastic Oscillator: Both %K and %D have been consistently high, indicating strong upward momentum.
- Williams %R: The Williams %R has been consistently negative, suggesting the stock is in oversold territory.
Volatility Indicators:
- Bollinger Bands (BB): The stock price has been trading within the upper Bollinger Band, indicating a potential overbought condition.
- Bollinger Band Width (BBW): The Bollinger Band Width has been decreasing, suggesting a decrease in volatility.
Volume Indicators:
- On-Balance Volume (OBV): The OBV has been showing a slight decrease, indicating some selling pressure.
- Chaikin Money Flow (CMF): The CMF has been negative, suggesting a bearish money flow.
Key Observations and Opinions:
- Trend: The stock is in a strong bullish trend based on moving averages and MACD.
- Momentum: Momentum indicators like Stochastic Oscillator and RSI suggest strong upward momentum.
- Volatility: Bollinger Bands indicate a potential overbought condition, while decreasing BBW suggests decreasing volatility.
- Volume: The OBV shows some selling pressure, while CMF indicates a bearish money flow.
Conclusion:
Based on the analysis of the technical indicators, the next few days' possible stock price movement is likely to be upward. The stock is in a strong bullish trend with positive momentum indicators. However, caution should be exercised as the stock may be in an overbought condition based on Bollinger Bands. Traders and investors should closely monitor the price action and consider taking profits or implementing risk management strategies to capitalize on the potential upside while managing the risks associated with the current market conditions.