Technical Analysis of ESGD 2024-05-10
Overview:
In analyzing the technical indicators for ESGD over the last 5 days, we will delve into the trend, momentum, volatility, and volume indicators to provide a comprehensive outlook on the possible stock price movement in the coming days. By examining these key aspects, we aim to offer valuable insights and predictions for informed decision-making.
Trend Analysis:
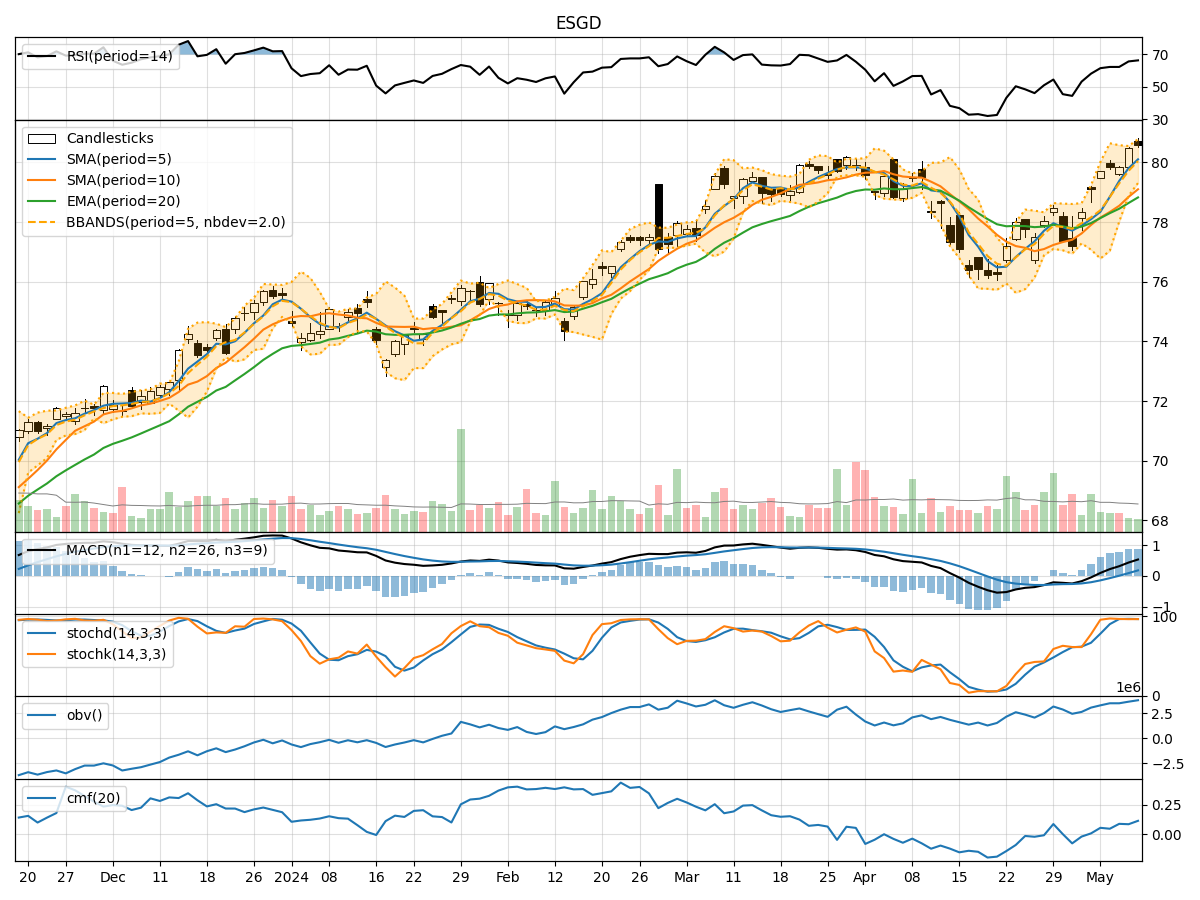
- Moving Averages (MA): The 5-day Moving Average has been consistently rising, indicating a bullish trend in the short term.
- MACD: The MACD line has been above the signal line, suggesting positive momentum in the stock price.
- RSI: The Relative Strength Index has been increasing, reflecting strengthening buying pressure.
Momentum Analysis:
- Stochastic Oscillator: Both %K and %D have been in the overbought zone, signaling a potential reversal or consolidation.
- Williams %R: The indicator has been fluctuating around the oversold region, implying a mixed sentiment among traders.
Volatility Analysis:
- Bollinger Bands: The stock price has been trading within the bands, indicating a period of consolidation.
- Average True Range (ATR): The ATR has been relatively stable, suggesting consistent price movements.
Volume Analysis:
- On-Balance Volume (OBV): The OBV has been increasing, indicating accumulation by investors.
- Chaikin Money Flow (CMF): The CMF has been positive, reflecting buying pressure in the stock.
Key Observations:
- The trend indicators suggest a bullish sentiment in the short term.
- Momentum indicators show signs of potential overbought conditions, hinting at a possible correction.
- Volatility indicators point towards a period of consolidation.
- Volume indicators indicate increasing buying interest in the stock.
Conclusion:
Based on the analysis of the technical indicators, the next few days' possible stock price movement for ESGD is likely to be sideways with a slight upward bias. While the trend remains bullish in the short term, the overbought signals from momentum indicators and the consolidation pattern indicated by volatility indicators suggest a potential period of sideways movement. Investors should closely monitor key support and resistance levels for potential entry or exit points.