Technical Analysis of ESGE 2024-05-10
Overview:
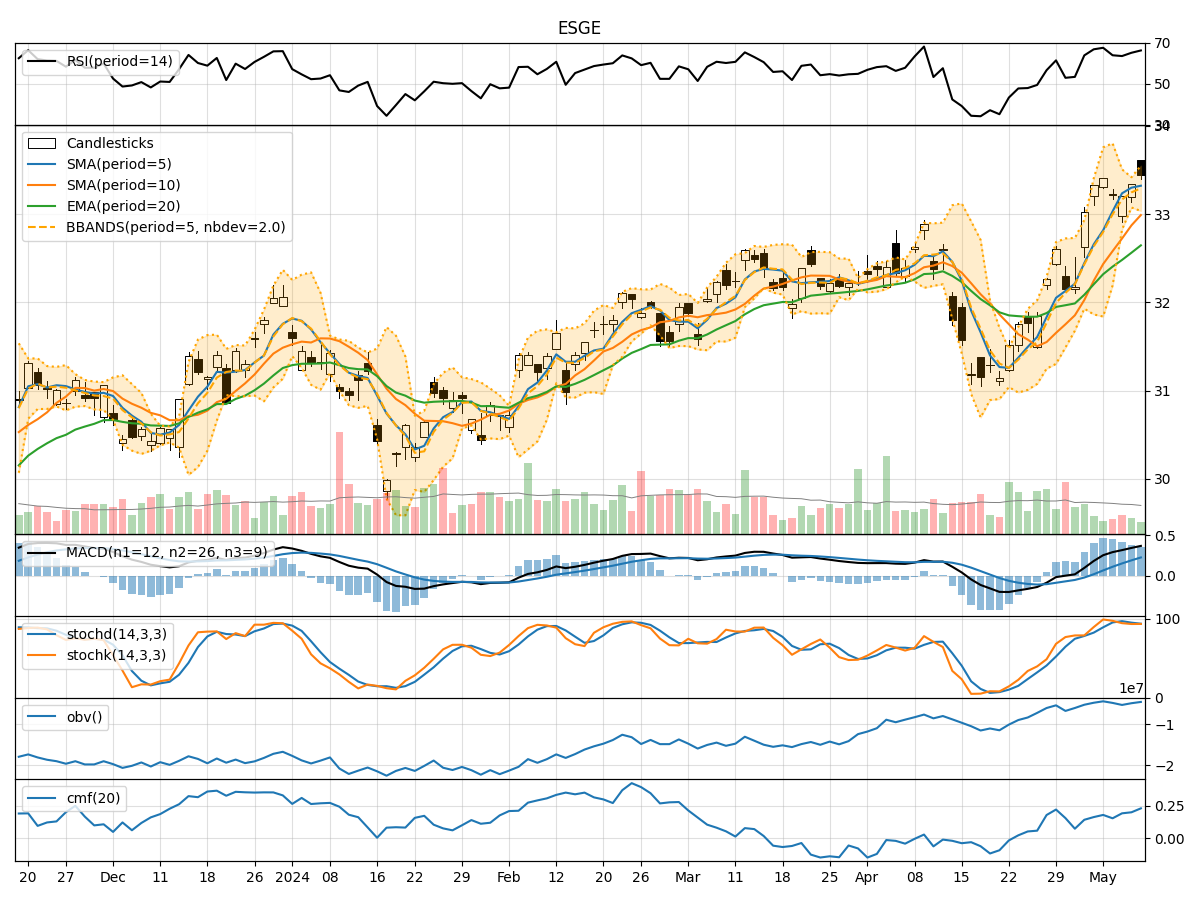
In analyzing the technical indicators for ESGE stock over the last 5 days, we will delve into the trend, momentum, volatility, and volume indicators to provide a comprehensive outlook on the possible stock price movement in the coming days. By examining these key indicators, we aim to offer valuable insights and predictions for informed decision-making.
Trend Analysis:
- Moving Averages (MA): The 5-day Moving Average (MA) has been consistently above the Simple Moving Average (SMA) and Exponential Moving Average (EMA), indicating a bullish trend.
- MACD: The MACD line has been consistently above the signal line, with both lines showing an upward trend, suggesting bullish momentum.
- Momentum: The stock price has been consistently above the MA(5), SMA(10), and EMA(20), further supporting the bullish trend.
Momentum Analysis:
- RSI: The Relative Strength Index (RSI) has been above 50, indicating bullish momentum in the stock.
- Stochastic Oscillator: Both %K and %D lines have been in the overbought zone, suggesting a strong bullish momentum.
- Williams %R: The Williams %R has been consistently in the oversold territory, indicating a potential reversal to the upside.
Volatility Analysis:
- Bollinger Bands: The stock price has been trading within the Bollinger Bands, with the bands narrowing, indicating decreasing volatility.
- Bollinger %B: The %B indicator has been hovering around 0.8, suggesting a bullish sentiment in the market.
Volume Analysis:
- On-Balance Volume (OBV): The OBV indicator has been steadily increasing, indicating strong buying pressure in the stock.
- Chaikin Money Flow (CMF): The CMF has been positive and increasing, signaling accumulation by investors.
Conclusion:
Based on the analysis of the technical indicators, the stock of ESGE is exhibiting strong bullish signals across trend, momentum, volatility, and volume indicators. The moving averages, MACD, RSI, Stochastic Oscillator, OBV, and CMF all point towards a continuation of the upward trend in the stock price. The decreasing volatility and bullish sentiment further support the upward movement in the stock price in the coming days.
Recommendation:
Considering the overall bullish outlook, investors may consider buying ESGE stock for potential short to medium-term gains. It is essential to monitor the price action closely and set appropriate stop-loss levels to manage risk effectively. Additionally, staying updated on any significant news or market developments that could impact the stock price is crucial for making informed investment decisions.