Technical Analysis of ESGN 2024-05-10
Overview:
In analyzing the technical indicators for ESGN stock over the last 5 days, we will delve into the trends, momentum, volatility, and volume aspects to provide a comprehensive outlook on the possible stock price movement in the coming days. By examining key indicators such as moving averages, MACD, RSI, Bollinger Bands, and OBV, we aim to offer valuable insights and predictions for informed decision-making.
Trend Analysis:
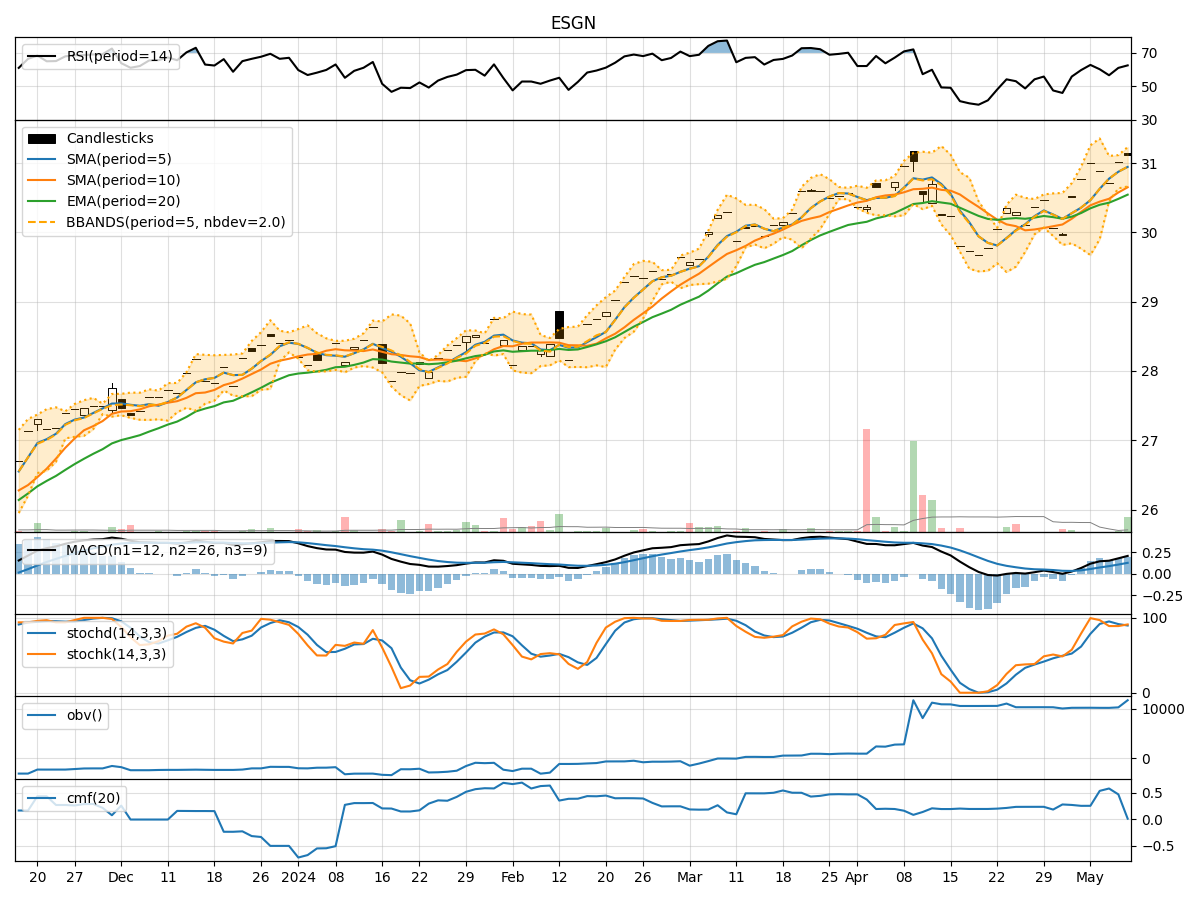
- Moving Averages (MA): The 5-day MA has been consistently above the closing prices, indicating a bullish trend.
- MACD: The MACD line has been above the signal line, with both lines showing an upward trend, suggesting bullish momentum.
Momentum Analysis:
- RSI: The RSI has been fluctuating around the overbought territory, indicating strong buying pressure.
- Stochastic Oscillator: Both %K and %D have been in the overbought zone, suggesting a potential reversal.
Volatility Analysis:
- Bollinger Bands (BB): The stock price has been trading within the bands, with the bands narrowing, indicating reduced volatility.
Volume Analysis:
- On-Balance Volume (OBV): The OBV has been steadily increasing, reflecting accumulation by investors.
Key Observations:
- The stock is currently in an upward trend based on moving averages and MACD.
- Momentum indicators like RSI and Stochastic Oscillator suggest a bullish sentiment but also hint at a possible overbought condition.
- Volatility has been decreasing, indicating a potential consolidation phase.
- The increasing OBV signals positive investor sentiment and buying interest.
Conclusion:
Based on the analysis of technical indicators, the next few days for ESGN stock are likely to see a continuation of the upward trend supported by strong buying momentum. However, caution is advised as the stock may be overbought according to momentum indicators. The decreasing volatility suggests a potential consolidation phase, where the stock price may trade within a narrower range. Investors should closely monitor key levels and consider taking profits or implementing risk management strategies in case of a reversal. Overall, the outlook remains bullish with a possibility of sideways movement in the short term.