Technical Analysis of ESGS 2024-05-10
Overview:
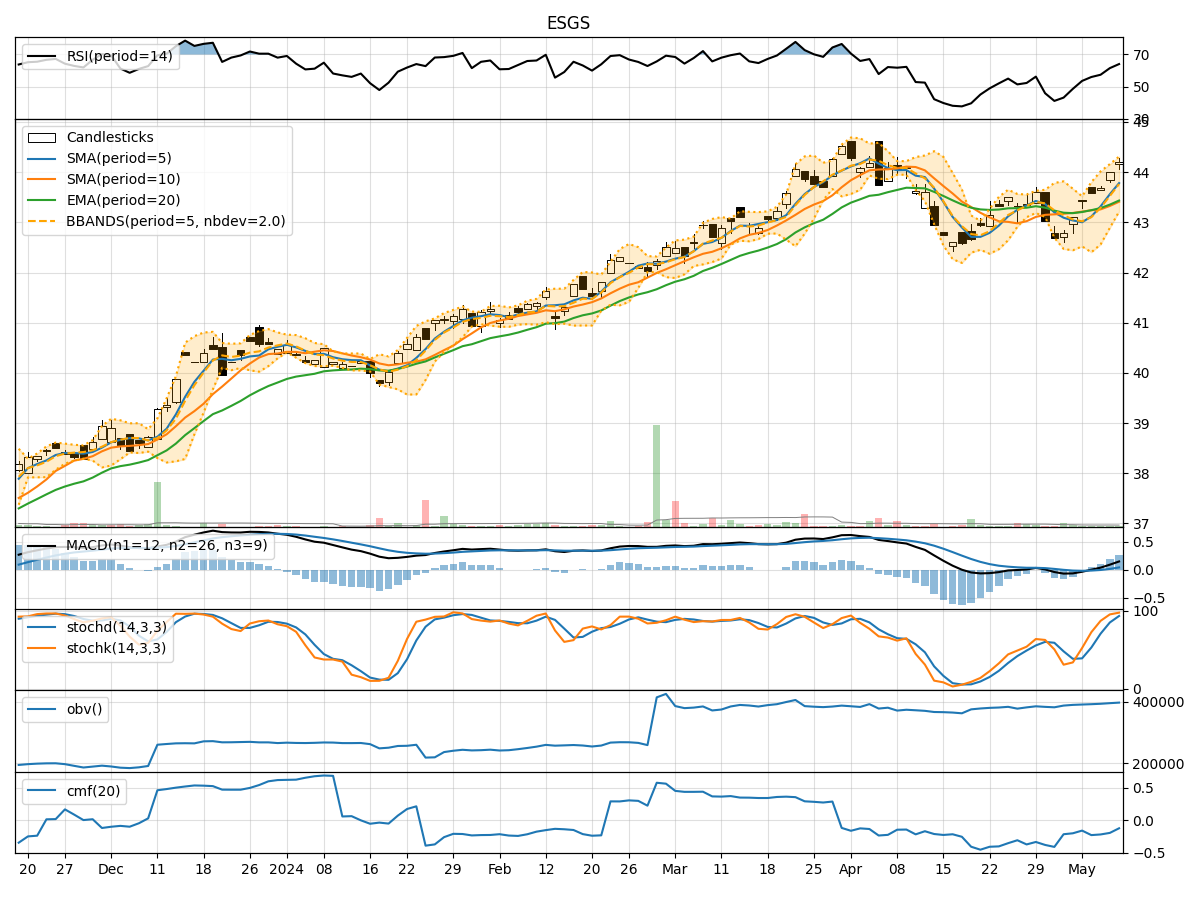
In the last 5 trading days, ESGS stock has shown a consistent uptrend in both price and volume. The moving averages have been trending upwards, indicating a bullish sentiment. Momentum indicators like RSI and Stochastic oscillators are in overbought territory, suggesting a potential pullback. Volatility indicators show a narrowing Bollinger Band, indicating a possible decrease in price volatility. Volume indicators have been steadily increasing, supporting the recent price appreciation.
Trend Analysis:
- Moving Averages (MA): The 5-day moving average has been consistently above the longer-term SMAs and EMAs, indicating a strong bullish trend.
- MACD: The MACD line has been above the signal line for the past few days, showing positive momentum.
Momentum Analysis:
- RSI: The RSI is in overbought territory, suggesting that the stock may be due for a correction or consolidation.
- Stochastic Oscillators: Both %K and %D are in the overbought zone, indicating a potential reversal in the short term.
Volatility Analysis:
- Bollinger Bands: The Bollinger Bands are narrowing, indicating a decrease in price volatility and a possible period of consolidation.
Volume Analysis:
- On-Balance Volume (OBV): The OBV has been steadily increasing, showing that volume has been higher on up days compared to down days.
- Chaikin Money Flow (CMF): The CMF is negative, indicating some distribution in the stock.
Key Observations:
- The stock is currently in a strong uptrend based on moving averages.
- Momentum indicators suggest the stock is overbought and may experience a pullback.
- Volatility is decreasing, indicating a potential period of consolidation.
- Volume has been increasing, supporting the recent price rise.
Conclusion:
Based on the technical indicators and analysis: - Short-Term: The stock may experience a pullback or consolidation in the next few days due to overbought conditions indicated by momentum indicators. - Medium-Term: The overall trend remains bullish, but a period of consolidation or sideways movement is likely before another leg up. - Long-Term: The stock is in a healthy uptrend supported by increasing volume, but investors should be cautious of potential profit-taking in the short term.
Recommendation:
- Short-Term Traders: Consider taking profits or setting stop-loss orders to protect gains during the expected pullback.
- Long-Term Investors: Hold onto positions but be prepared for increased volatility and potential buying opportunities during the consolidation phase.
Always remember to monitor the stock closely and adjust your strategy based on evolving market conditions.