Technical Analysis of ESGY 2024-05-10
Overview:
In analyzing the technical indicators for ESGY over the last 5 days, we will delve into the trend, momentum, volatility, and volume indicators to provide a comprehensive outlook on the possible stock price movement in the coming days. By examining these key aspects, we aim to offer valuable insights and predictions to guide your investment decisions.
Trend Analysis:
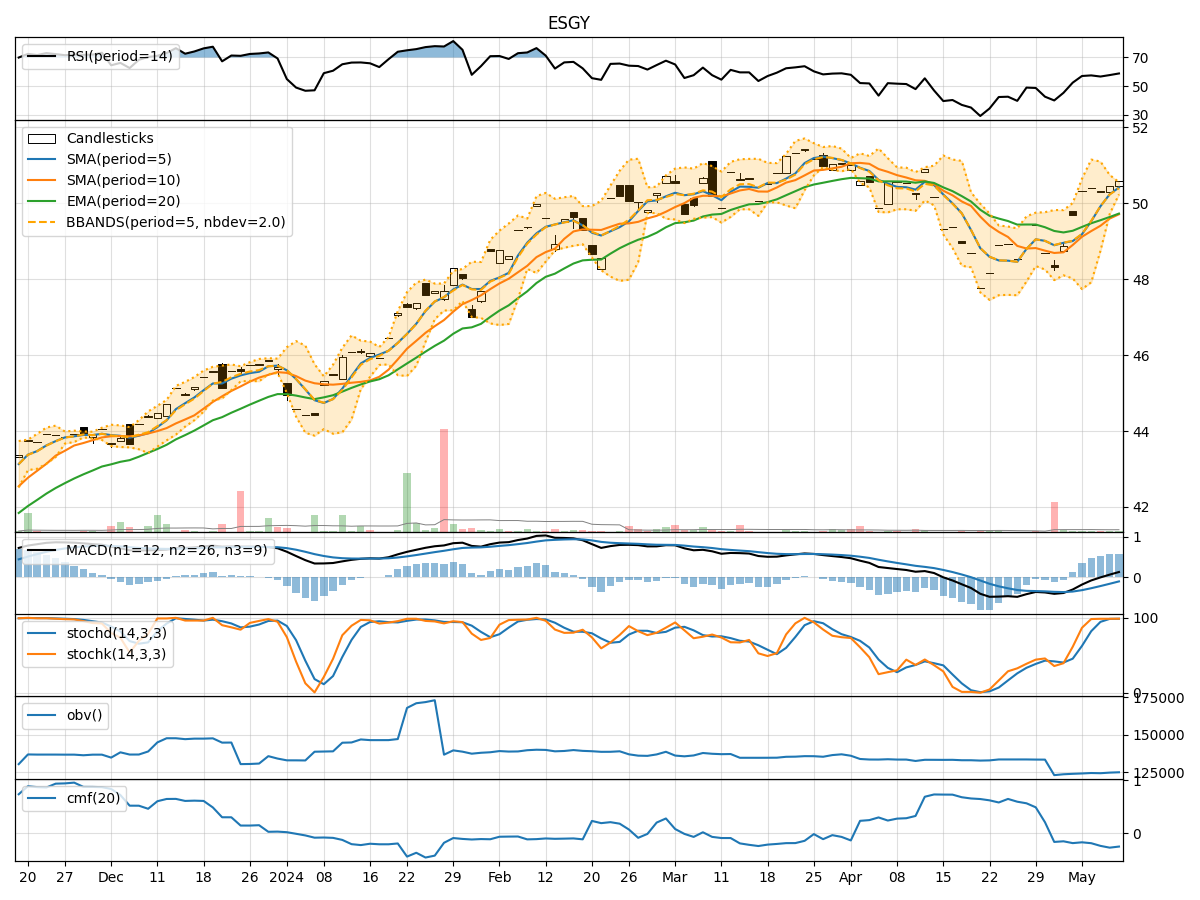
- Moving Averages (MA): The 5-day Moving Average (MA) has been consistently above the Simple Moving Average (SMA) and Exponential Moving Average (EMA), indicating a bullish trend.
- MACD: The Moving Average Convergence Divergence (MACD) has shown positive values, with the MACD line consistently above the Signal line, suggesting upward momentum.
- RSI: The Relative Strength Index (RSI) has been fluctuating around the 50 level, indicating a neutral stance in terms of overbought or oversold conditions.
Momentum Analysis:
- Stochastic Oscillator: Both %K and %D values of the Stochastic Oscillator have been consistently high, suggesting strong upward momentum.
- Williams %R: The Williams %R indicator has been hovering around 0, indicating a neutral stance in terms of potential overbought or oversold conditions.
Volatility Analysis:
- Bollinger Bands (BB): The Bollinger Bands have shown a narrowing of the bands, indicating decreasing volatility in the stock price.
- BB% (BB Percentage): The BB% has been relatively low, suggesting a period of consolidation or stability in price movement.
Volume Analysis:
- On-Balance Volume (OBV): The OBV has shown a slight decrease over the last 5 days, indicating some selling pressure in the stock.
- Chaikin Money Flow (CMF): The CMF has been negative, reflecting a bearish sentiment in terms of money flow.
Conclusion:
Based on the analysis of the technical indicators, the overall outlook for ESGY in the next few days leans towards a sideways consolidation pattern. The bullish trend indicated by moving averages and MACD, coupled with strong momentum from the Stochastic Oscillator, suggests a potential for upward movement. However, the neutral RSI and negative OBV and CMF signal caution. The decreasing volatility and stable BB% point towards a period of consolidation. Therefore, it is advisable to closely monitor the stock for any breakout or reversal signals before making trading decisions.