Technical Analysis of ESIX 2024-05-10
Overview:
In analyzing the technical indicators for ESIX over the last 5 days, we will delve into the trend, momentum, volatility, and volume indicators to provide a comprehensive outlook on the possible stock price movement in the coming days. By examining these key aspects, we aim to offer valuable insights and recommendations for potential investors.
Trend Indicators:
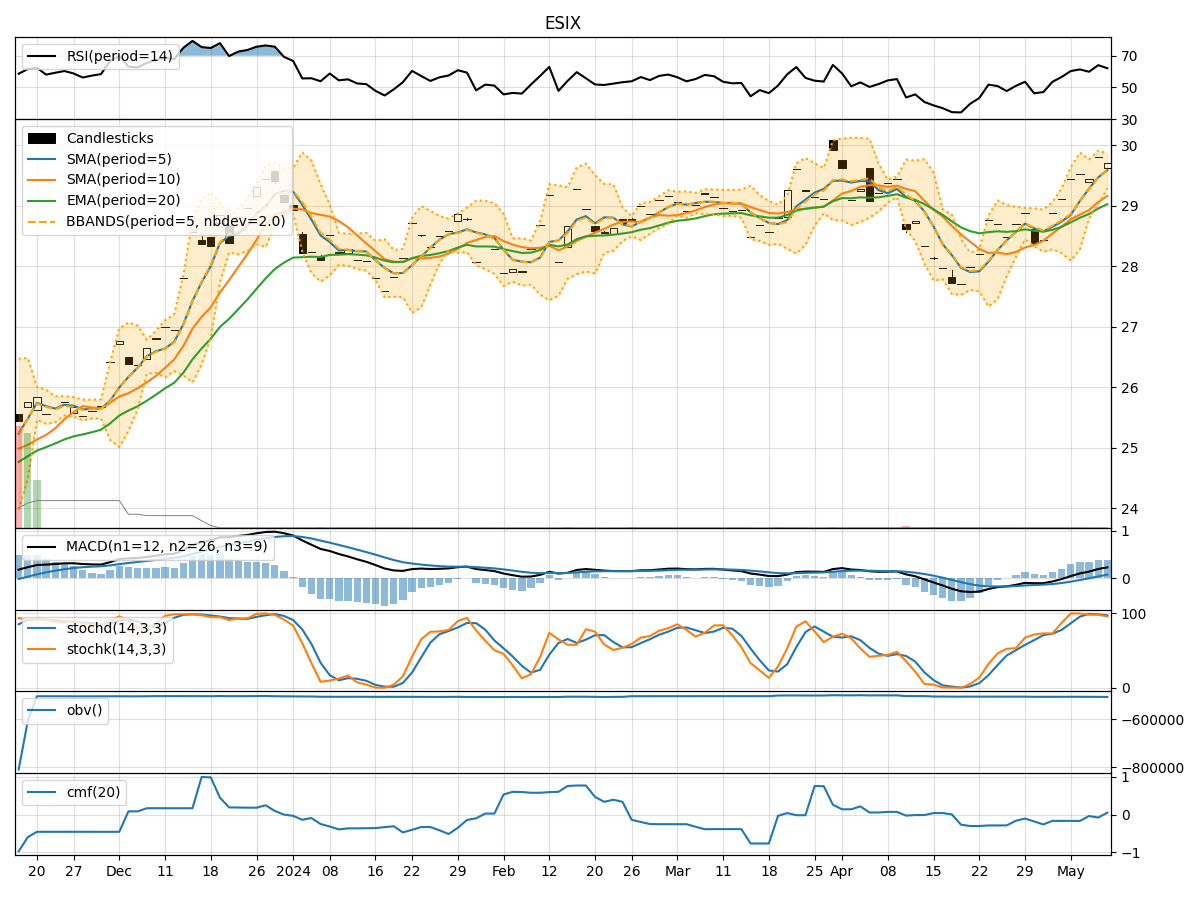
- Moving Averages (MA): The moving averages have been on an upward trend, with the 5-day MA consistently above the longer-term SMAs and EMAs. This indicates a positive momentum in the stock price.
- MACD: The MACD line has been consistently above the signal line, suggesting a bullish trend in the stock.
- MACD Histogram: The MACD histogram has been showing positive values, indicating increasing bullish momentum in the stock.
Momentum Indicators:
- RSI: The RSI has been fluctuating around the 60-65 range, indicating a neutral to slightly bullish momentum in the stock.
- Stochastic Oscillator: The stochastic oscillator has been in the overbought territory, suggesting a potential reversal or consolidation in the stock price.
- Williams %R: The Williams %R has been hovering in the oversold territory, signaling a potential buying opportunity.
Volatility Indicators:
- Bollinger Bands: The Bollinger Bands have been narrowing, indicating decreasing volatility in the stock price.
- Bollinger %B: The %B indicator has been fluctuating around the midline, suggesting a period of consolidation in the stock.
Volume Indicators:
- On-Balance Volume (OBV): The OBV has been fluctuating, indicating mixed buying and selling pressure in the stock.
- Chaikin Money Flow (CMF): The CMF has been negative, suggesting a lack of buying interest in the stock.
Key Observations:
- The trend indicators suggest a bullish sentiment in the stock, supported by the moving averages and MACD.
- Momentum indicators show a neutral to slightly bullish momentum, with the stochastic oscillator indicating a potential reversal.
- Volatility indicators point towards decreasing volatility and a period of consolidation.
- Volume indicators reflect mixed buying and selling pressure, with the CMF indicating a lack of significant buying interest.
Conclusion:
Based on the analysis of the technical indicators, the stock price of ESIX is likely to experience a period of consolidation in the coming days. The bullish trend indicated by the moving averages and MACD may face resistance due to the overbought levels in the stochastic oscillator. The decreasing volatility and mixed volume signals further support the view of a sideways movement in the stock price. Investors should exercise caution and wait for clearer signals before making significant trading decisions.