Technical Analysis of ETEC 2024-05-10
Overview:
In analyzing the technical indicators for ETEC over the last 5 days, we will delve into the trend, momentum, volatility, and volume indicators to provide a comprehensive outlook on the possible stock price movement. By examining these key indicators, we aim to offer valuable insights and predictions for the upcoming days.
Trend Indicators:
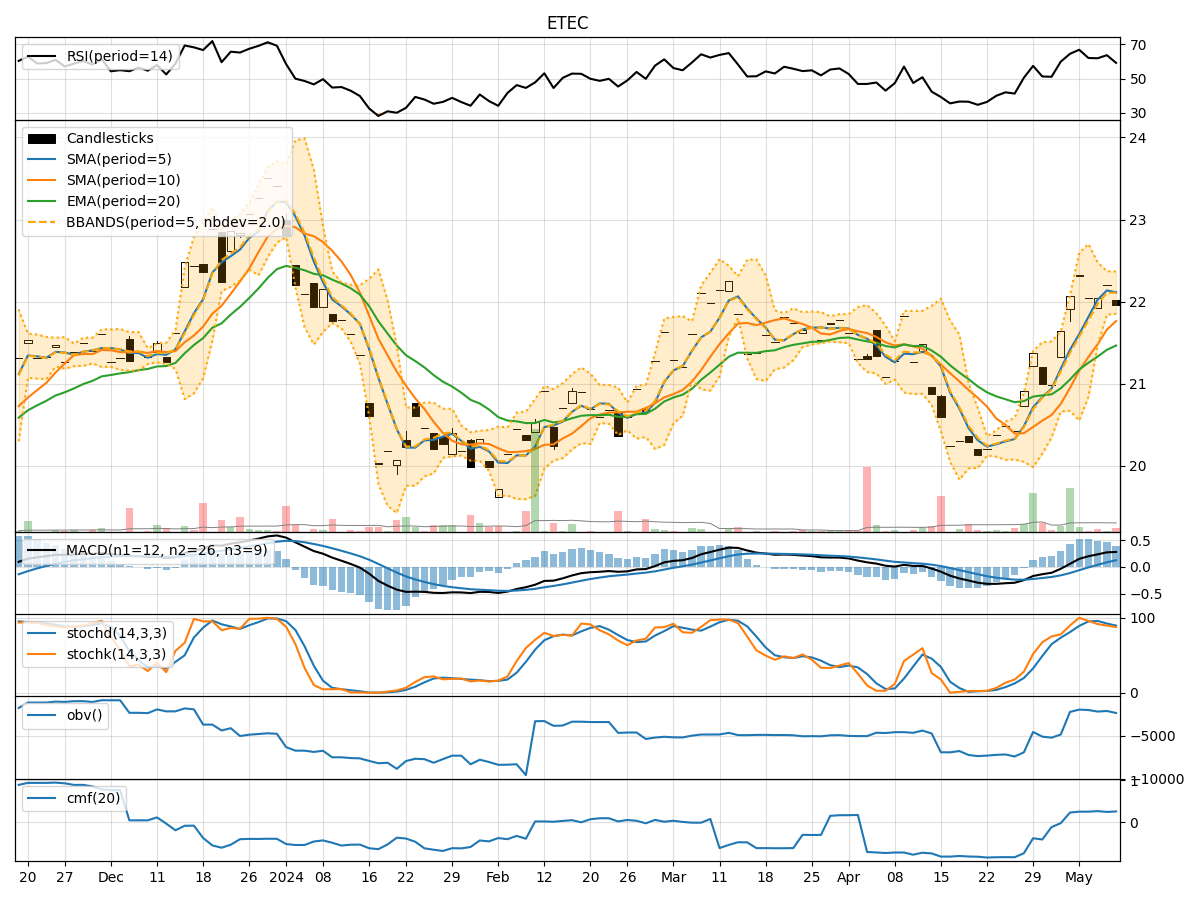
- Moving Averages (MA): The 5-day Moving Average (MA) has been consistently above the Simple Moving Average (SMA) and Exponential Moving Average (EMA), indicating a bullish trend.
- MACD: The MACD line has been consistently above the signal line, with both lines showing an upward trend, suggesting bullish momentum.
- MACD Histogram: The MACD Histogram has been increasing over the past 5 days, indicating strengthening bullish momentum.
Momentum Indicators:
- RSI: The Relative Strength Index (RSI) has been fluctuating around the 60-70 range, indicating a neutral to slightly bullish momentum.
- Stochastic Oscillator: Both %K and %D lines of the Stochastic Oscillator have been gradually decreasing but remain in the overbought territory, suggesting a potential reversal.
- Williams %R: The Williams %R has been in the oversold territory, indicating a potential buying opportunity.
Volatility Indicators:
- Bollinger Bands: The stock price has been trading within the Bollinger Bands, with the bands narrowing, suggesting decreasing volatility.
- Bollinger %B: The %B indicator has been hovering around the middle range, indicating a neutral stance in terms of volatility.
Volume Indicators:
- On-Balance Volume (OBV): The OBV has been fluctuating but has not shown a clear trend, indicating mixed buying and selling pressure.
- Chaikin Money Flow (CMF): The CMF has been relatively stable around the neutral level, suggesting a balance between buying and selling pressure.
Key Observations:
- The trend indicators suggest a strong bullish sentiment, supported by the moving averages and MACD.
- Momentum indicators show a neutral to slightly bullish momentum, with potential signs of a reversal in the Stochastic Oscillator.
- Volatility indicators point towards decreasing volatility, potentially leading to a period of consolidation.
- Volume indicators indicate mixed buying and selling pressure, with no clear trend in OBV and CMF.
Conclusion:
Based on the analysis of the technical indicators, the next few days for ETEC are likely to see sideways movement with a slight bullish bias. Traders should monitor the Stochastic Oscillator for a potential reversal signal and keep an eye on the OBV for any significant shifts in buying or selling pressure. Overall, the stock is expected to consolidate within the current price range before potentially resuming its upward trend.