Technical Analysis of EUDG 2024-05-10
Overview:
In analyzing the technical indicators for EUDG stock over the last 5 days, we will delve into the trend, momentum, volatility, and volume indicators to provide a comprehensive outlook on the possible stock price movement in the coming days. By examining these key indicators, we aim to offer valuable insights and recommendations for potential investors.
Trend Indicators:
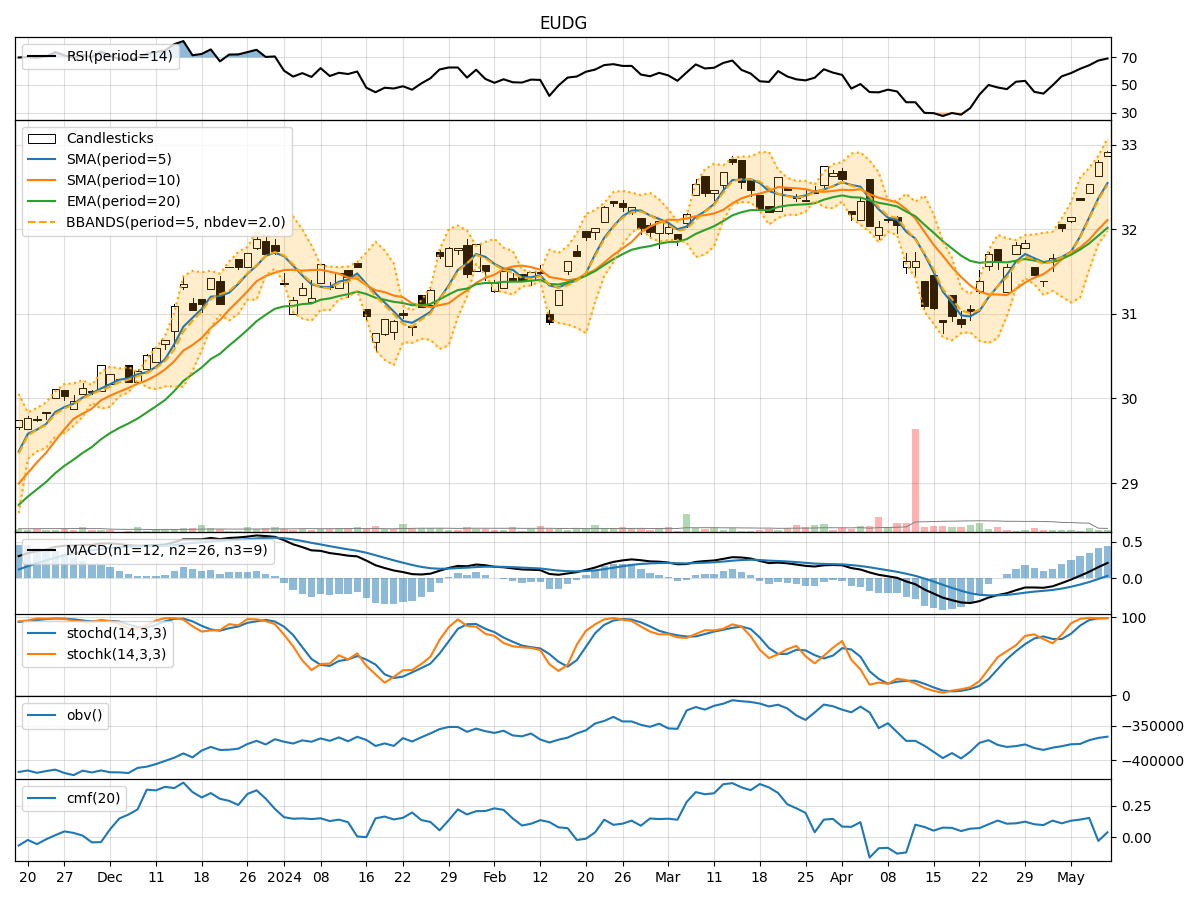
- Moving Averages (MA): The 5-day Moving Average (MA) has been consistently above the Simple Moving Average (SMA) and Exponential Moving Average (EMA), indicating a bullish trend.
- MACD: The MACD line has been consistently above the signal line, with both lines showing an upward trend, suggesting bullish momentum.
- Conclusion: The trend indicators point towards an upward trend for EUDG stock.
Momentum Indicators:
- RSI: The Relative Strength Index (RSI) has been increasing and is currently in the overbought territory, indicating strong buying momentum.
- Stochastic Oscillator: Both %K and %D lines of the Stochastic Oscillator are in the overbought zone, suggesting a potential reversal.
- Conclusion: Momentum indicators signal a potential reversal or a period of consolidation for EUDG stock.
Volatility Indicators:
- Bollinger Bands: The stock price has been trading within the Bollinger Bands, with the bands widening slightly, indicating increased volatility.
- Conclusion: Volatility indicators suggest increased volatility in the stock price of EUDG.
Volume Indicators:
- On-Balance Volume (OBV): The OBV has been fluctuating, indicating indecision among investors.
- Chaikin Money Flow (CMF): The CMF has been positive but trending downwards, suggesting weakening buying pressure.
- Conclusion: Volume indicators reflect indecisiveness and a potential decrease in buying pressure for EUDG stock.
Overall Conclusion:
Based on the analysis of trend, momentum, volatility, and volume indicators, the next few days for EUDG stock could see a period of consolidation or a potential reversal in the upward trend. Investors should closely monitor the price action and key support/resistance levels for confirmation of the stock's future direction. It is advisable to exercise caution and wait for clearer signals before making any significant trading decisions.