Technical Analysis of EUDV 2024-05-10
Overview:
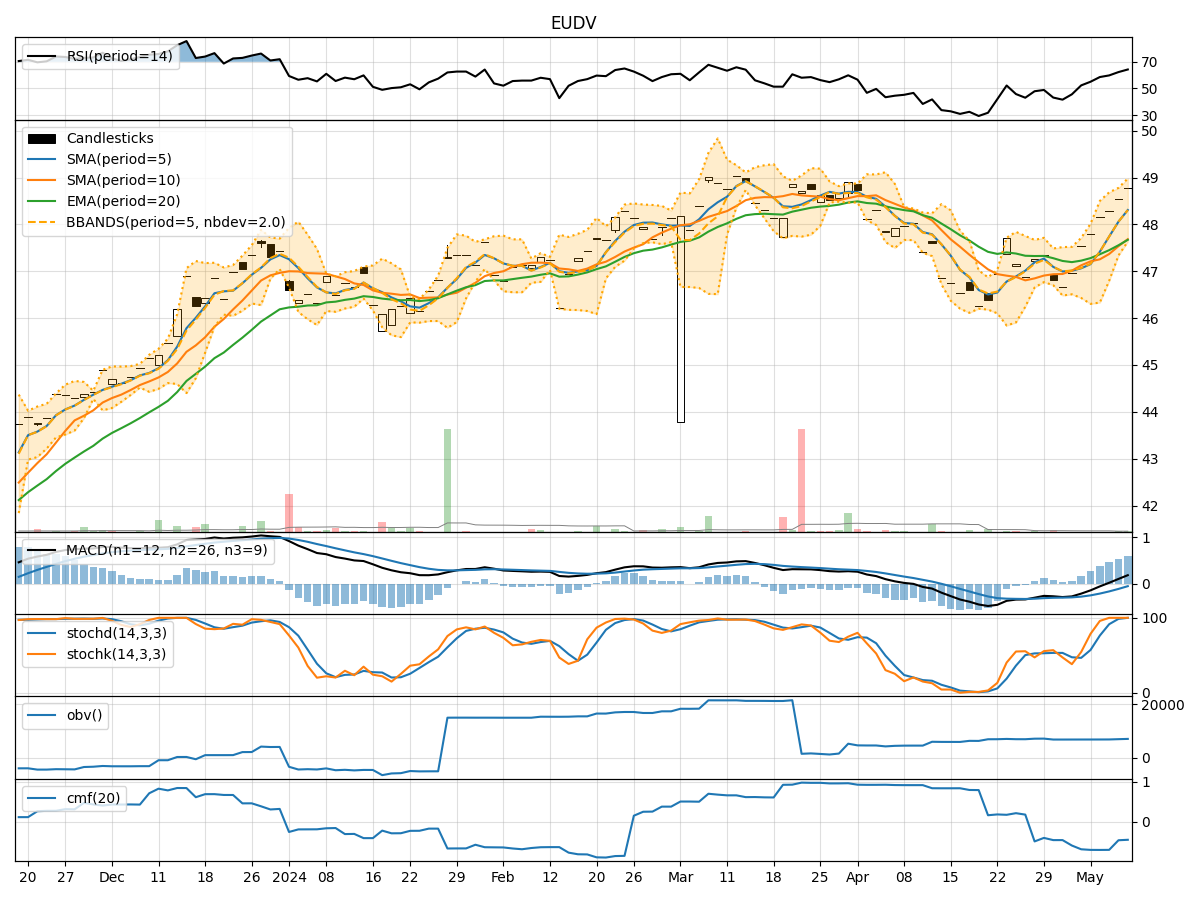
In analyzing the technical indicators for EUDV over the last 5 days, we will delve into the trend, momentum, volatility, and volume indicators to provide a comprehensive outlook on the possible stock price movement in the coming days. By examining these key indicators, we aim to offer valuable insights and predictions to guide your investment decisions.
Trend Indicators:
- Moving Averages (MA): The 5-day moving average has been consistently rising, indicating a bullish trend in the short term.
- MACD: The MACD line has been above the signal line, suggesting a bullish momentum.
- MACD Histogram: The histogram has been increasing, indicating strengthening bullish momentum.
Key Observation: The trend indicators point towards a bullish outlook for EUDV.
Momentum Indicators:
- RSI: The RSI has been increasing and is in the overbought territory, signaling strong buying momentum.
- Stochastic Oscillator: Both %K and %D have been at or near 100, indicating strong upward momentum.
- Williams %R: The indicator is at 0, suggesting that the stock is trading at the highest price over the look-back period.
Key Observation: Momentum indicators reflect a strong bullish sentiment for EUDV.
Volatility Indicators:
- Bollinger Bands: The stock price has been trading near the upper Bollinger Band, indicating high volatility.
- Bollinger %B: The %B is above 0.8, suggesting that the stock is trading at the upper end of its recent price range.
Key Observation: Volatility indicators suggest high volatility in EUDV.
Volume Indicators:
- On-Balance Volume (OBV): The OBV has been declining, indicating a decrease in buying volume.
- Chaikin Money Flow (CMF): The CMF is negative, suggesting that money is flowing out of the stock.
Key Observation: Volume indicators show a bearish sentiment in terms of buying volume for EUDV.
Conclusion:
Based on the analysis of trend, momentum, volatility, and volume indicators, the overall outlook for EUDV is as follows: - Trend: Upward - Momentum: Strongly Bullish - Volatility: High - Volume: Bearish
Possible Stock Price Movement:
Considering the bullish trend and momentum, EUDV is likely to continue its upward trajectory in the coming days. However, the high volatility and bearish volume indicators suggest that there may be some price fluctuations and potential pullbacks along the way. Traders should closely monitor the price action and key support levels to capitalize on potential buying opportunities during dips.
Recommendation:
Based on the technical analysis, it is recommended to consider buying EUDV with caution, taking advantage of potential dips to enter long positions. Traders should set stop-loss orders to manage risk effectively and capitalize on the bullish momentum while being mindful of the high volatility in the stock.
Disclaimer:
Remember that market conditions can change rapidly, and it is essential to conduct your own research and consider other fundamental factors before making any investment decisions. Consulting with a financial advisor is advisable to align your investment strategy with your financial goals and risk tolerance.