Technical Analysis of EUM 2024-05-10
Overview:
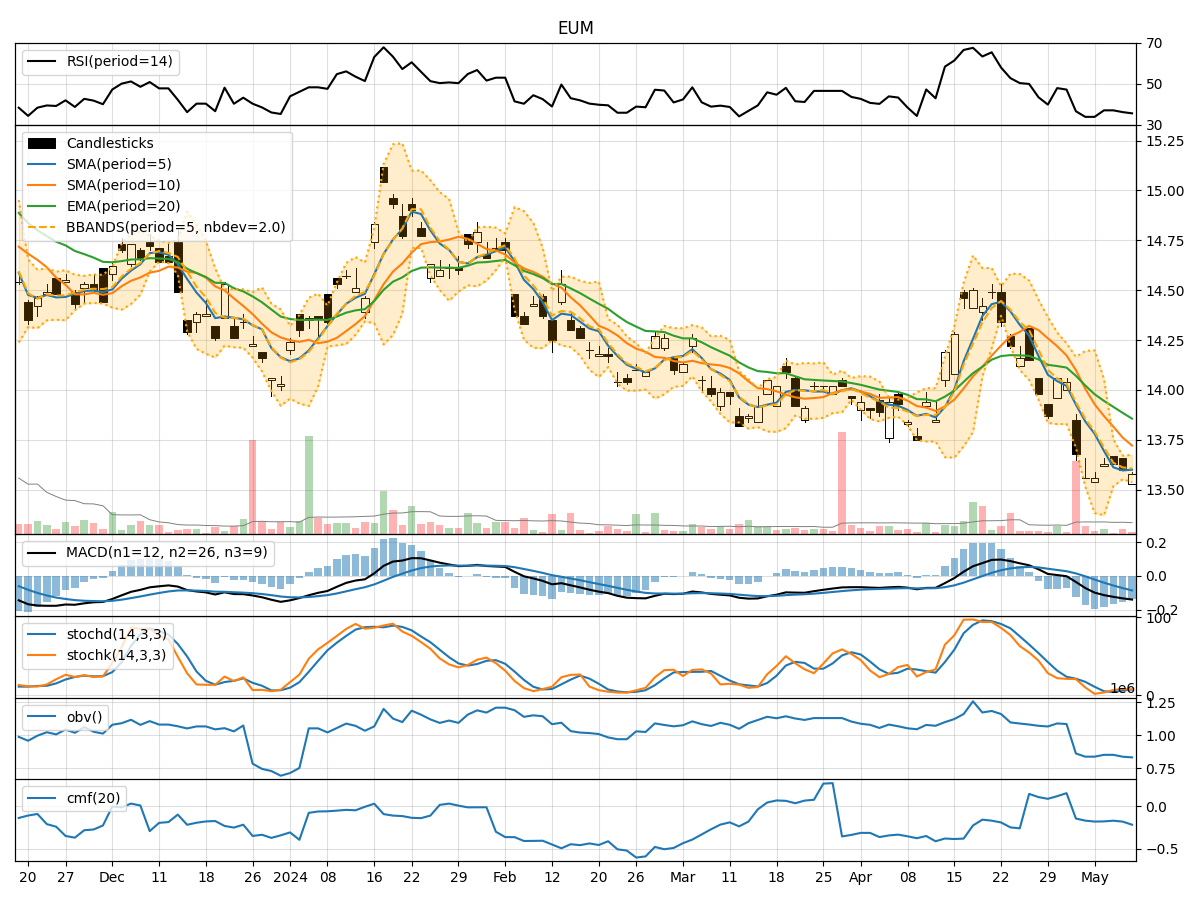
In analyzing the technical indicators for EUM over the last 5 days, we will delve into the trend, momentum, volatility, and volume indicators to provide a comprehensive outlook on the possible stock price movement in the coming days. By examining these key indicators, we aim to offer valuable insights and predictions for potential investors.
Trend Indicators:
- Moving Averages (MA): The 5-day Moving Average (MA) has been consistently below the closing price, indicating a short-term downtrend.
- MACD: The Moving Average Convergence Divergence (MACD) has been negative and decreasing, suggesting a bearish momentum.
- EMA: The Exponential Moving Average (EMA) has been declining, further supporting the bearish trend.
Momentum Indicators:
- RSI: The Relative Strength Index (RSI) has been below 50, indicating a bearish momentum.
- Stochastic Oscillator: Both %K and %D have been trending downwards, signaling a bearish sentiment.
- Williams %R: The Williams %R has been in oversold territory, suggesting a potential reversal but still indicating bearish pressure.
Volatility Indicators:
- Bollinger Bands (BB): The Bollinger Bands have been narrowing, indicating decreasing volatility.
- BB%: The %B indicator has been below 0.5, suggesting a bearish sentiment.
- BB Width: The Bollinger Band width has been contracting, indicating a potential decrease in volatility.
Volume Indicators:
- On-Balance Volume (OBV): The OBV has been negative, indicating selling pressure.
- Chaikin Money Flow (CMF): The CMF has been negative, suggesting a bearish sentiment in the market.
Key Observations:
- The trend indicators, momentum indicators, and volume indicators all point towards a bearish sentiment in the market.
- The narrowing Bollinger Bands and decreasing volatility indicate a potential lack of significant price movements in the near future.
- The overall technical picture suggests a continuation of the current downtrend in the stock price.
Conclusion:
Based on the analysis of the technical indicators, the next few days' possible stock price movement for EUM is likely to be downward. The bearish trend, negative momentum, and selling pressure indicated by the volume indicators all align to suggest a continuation of the current downtrend. Investors should exercise caution and consider waiting for more favorable technical signals before considering any long positions.