Technical Analysis of EURL 2024-05-10
Overview:
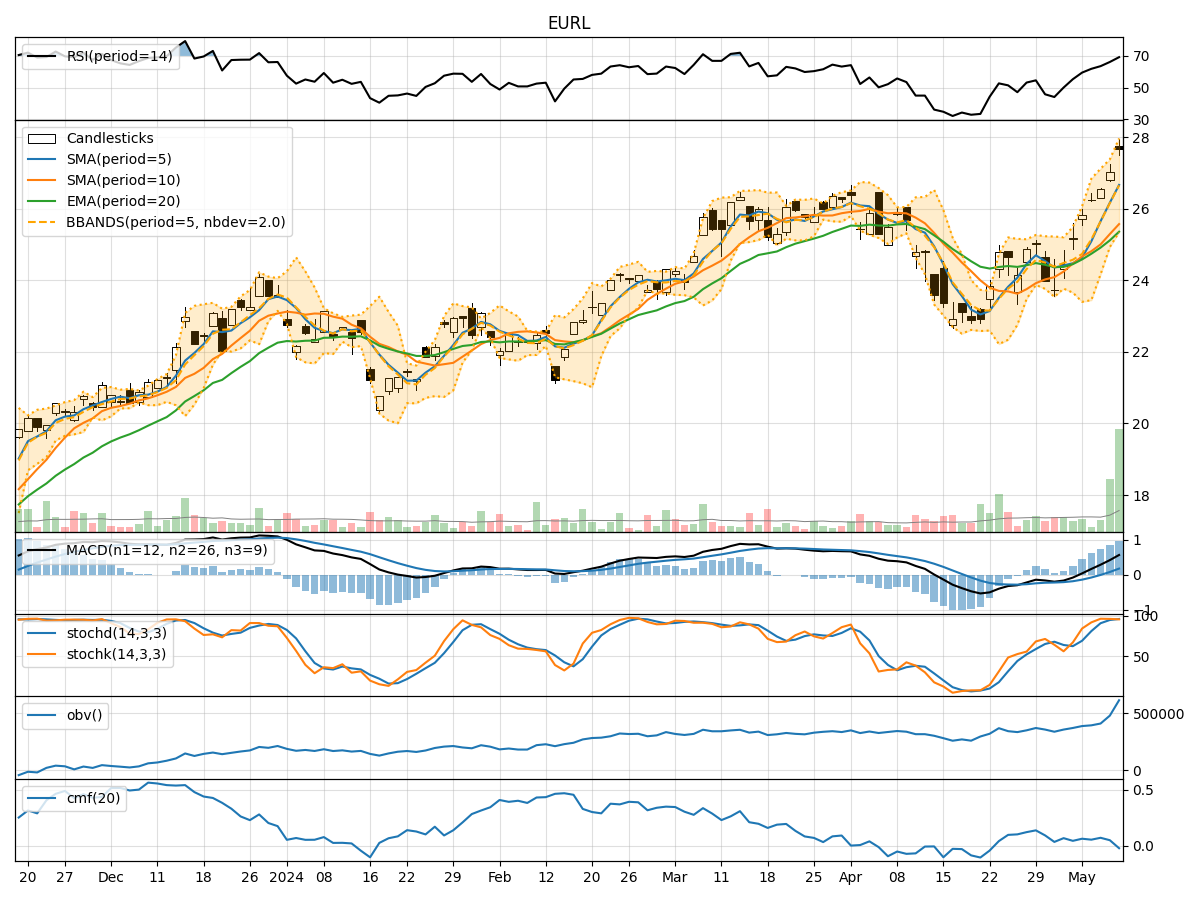
In the last 5 trading days, EURL stock has shown a consistent upward trend in both price and volume. The moving averages have been steadily increasing, indicating a bullish momentum. Momentum indicators such as RSI and Stochastic oscillators are in overbought territory, suggesting a strong buying pressure. Volatility indicators show a widening Bollinger Band, indicating increased price fluctuation. Volume indicators like OBV and CMF are also positive, reflecting strong buying interest.
Trend Analysis:
- Moving Averages (MA): The 5-day MA has been consistently above the longer-term SMAs, indicating a bullish trend. The EMA has been rising steadily, supporting the uptrend.
- MACD: The MACD line has been above the signal line for the past 5 days, with both lines trending upwards. The MACD histogram is also positive, indicating increasing bullish momentum.
Momentum Analysis:
- RSI: The RSI has been in the overbought zone for the last few days, suggesting a strong buying pressure and potential for a pullback.
- Stochastic Oscillators: Both %K and %D lines are in the overbought region, indicating a potential reversal or consolidation in the near future.
Volatility Analysis:
- Bollinger Bands (BB): The Bollinger Bands have been widening, indicating increased price volatility. The upper and lower bands are expanding, suggesting potential price swings in either direction.
Volume Analysis:
- On-Balance Volume (OBV): The OBV has been consistently rising, indicating strong buying volume accompanying the price increase.
- Chaikin Money Flow (CMF): The CMF has been positive, reflecting buying pressure and accumulation of the stock.
Key Observations:
- The stock is in a strong uptrend, supported by moving averages and MACD.
- Momentum indicators suggest overbought conditions, signaling a potential pullback or consolidation.
- Volatility is increasing, indicating potential price swings.
- Strong buying volume is evident from OBV and CMF indicators.
Conclusion:
Based on the technical analysis of EURL stock: - The stock is in a strong upward trend supported by moving averages and MACD. - Momentum indicators suggest caution as they are in overbought territory, indicating a potential reversal or consolidation. - Volatility is increasing, implying potential price fluctuations in the coming days. - Overall, the stock is bullish in the short term, but a pullback or consolidation phase may be on the horizon due to overbought conditions. Traders should monitor the stock closely for signs of a reversal.