Technical Analysis of EUSA 2024-05-10
Overview:
In analyzing the technical indicators for EUSA stock over the last 5 days, we will delve into the trend, momentum, volatility, and volume indicators to provide a comprehensive outlook on the possible stock price movement in the coming days. By examining these key aspects, we aim to offer valuable insights and predictions for potential investors.
Trend Indicators:
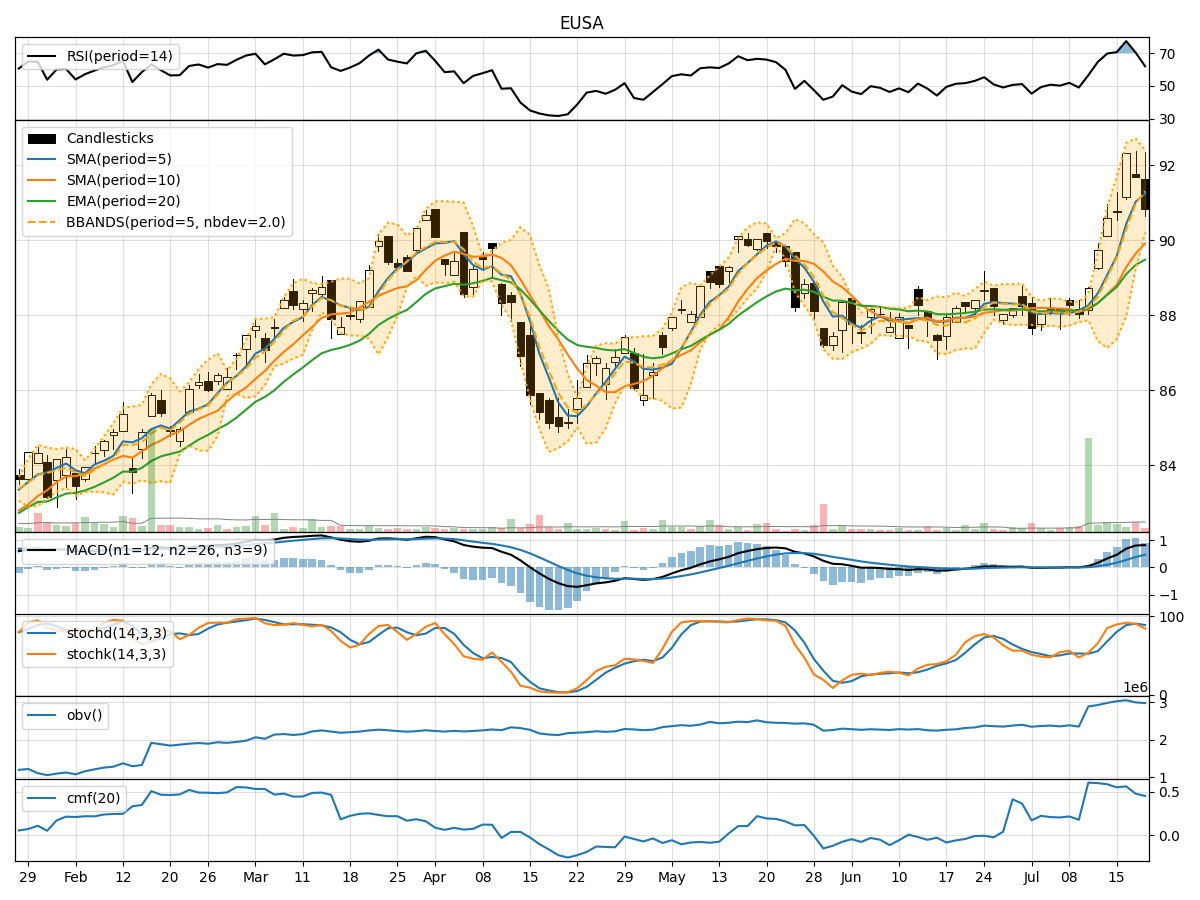
- Moving Averages (MA): The 5-day moving average has been consistently rising, indicating a bullish trend in the short term.
- MACD: The MACD line has been above the signal line for the past few days, suggesting a positive momentum in the stock price.
- EMA: The exponential moving average has also been trending upwards, supporting the bullish sentiment.
Key Observation: The trend indicators point towards a bullish outlook for EUSA stock.
Momentum Indicators:
- RSI: The Relative Strength Index has been increasing, showing strengthening momentum in the stock.
- Stochastic Oscillator: Both %K and %D have been relatively high, indicating potential overbought conditions.
- Williams %R: The Williams %R is fluctuating around the oversold territory, suggesting a possible reversal.
Key Observation: Momentum indicators suggest a mixed sentiment with potential for a short-term correction.
Volatility Indicators:
- Bollinger Bands: The stock price has been trading within the bands, indicating moderate volatility.
- Bollinger %B: The %B is hovering around the middle, suggesting a balanced volatility level.
Key Observation: Volatility indicators signal a stable market with no extreme fluctuations expected.
Volume Indicators:
- On-Balance Volume (OBV): The OBV has been increasing, reflecting positive buying pressure.
- Chaikin Money Flow (CMF): The CMF is negative, indicating some selling pressure in the stock.
Key Observation: Volume indicators show a slight bearish sentiment due to the negative CMF.
Conclusion:
Based on the analysis of trend, momentum, volatility, and volume indicators, the overall outlook for EUSA stock in the next few days is bullish with a potential for a short-term correction. The trend indicators support a positive trajectory, while momentum indicators suggest a mixed sentiment with a possibility of a pullback. Volatility remains stable, indicating no major price swings expected. However, the slight bearish sentiment in volume indicators warrants caution.
Recommendation:
Considering the bullish trend and positive momentum, investors may consider buying EUSA stock for potential short-term gains. However, it is advisable to closely monitor the momentum indicators for any signs of a reversal and adjust the strategy accordingly. Additionally, keeping an eye on volume movements can provide insights into market sentiment and potential price direction.