Technical Analysis of EV 2024-05-10
Overview:
In analyzing the technical indicators for EV stock over the last 5 days, we will delve into the trend, momentum, volatility, and volume indicators to provide a comprehensive outlook on the possible stock price movement in the coming days.
Trend Analysis:
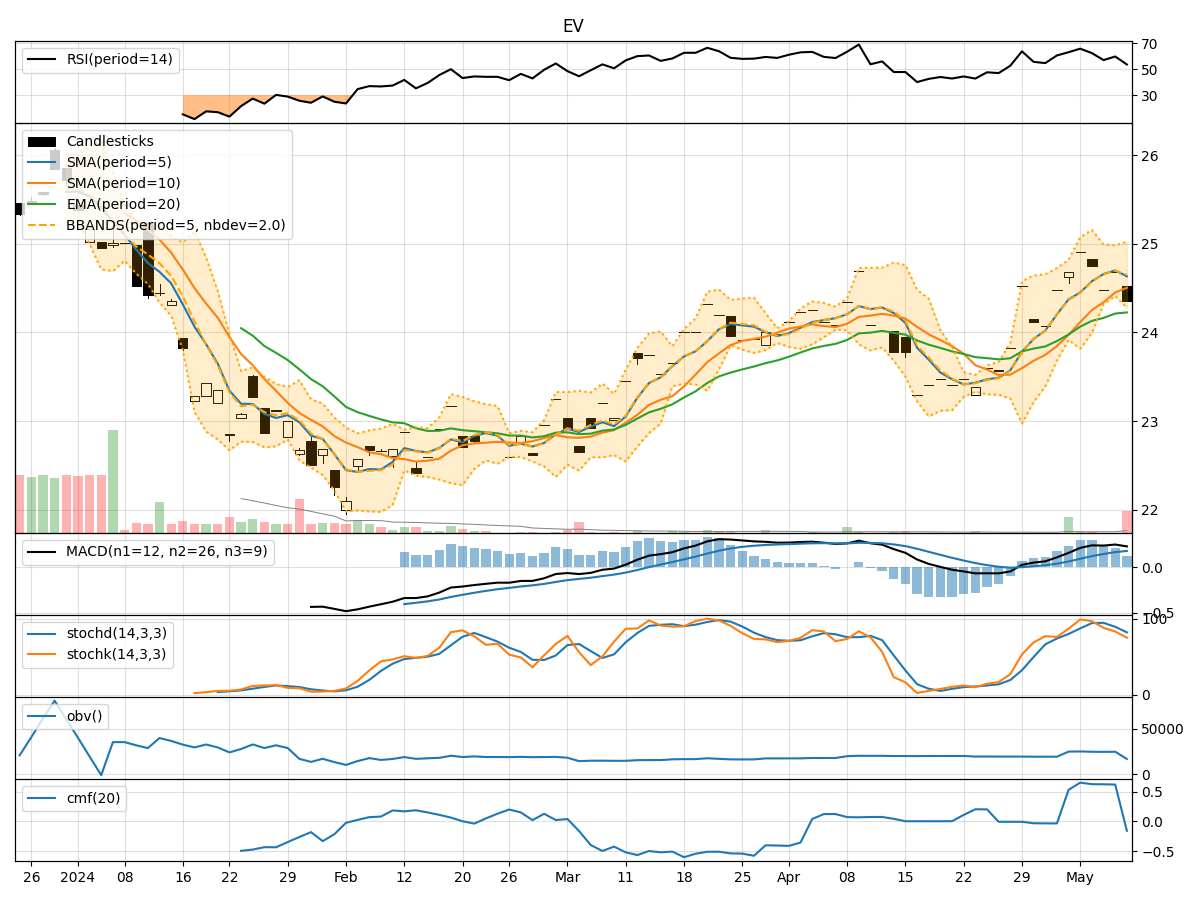
- Moving Averages (MA): The 5-day Moving Average (MA) has been fluctuating around the closing prices, indicating short-term price trends. The Simple Moving Average (SMA) and Exponential Moving Average (EMA) have shown a slight upward trend, suggesting a potential bullish sentiment.
- MACD: The Moving Average Convergence Divergence (MACD) has been positive, with the MACD line consistently above the signal line. This indicates a bullish momentum in the stock price.
- Conclusion: The trend indicators suggest a bullish outlook for the stock price in the near term.
Momentum Analysis:
- RSI: The Relative Strength Index (RSI) has been fluctuating but generally staying above the oversold threshold of 30, indicating bullish momentum.
- Stochastic Oscillator: Both %K and %D have been declining but are still in the overbought zone, suggesting a potential reversal in the bullish momentum.
- Conclusion: The momentum indicators show a mixed signal, with a slight bias towards a bearish reversal.
Volatility Analysis:
- Bollinger Bands (BB): The Bollinger Bands have been narrowing, indicating decreasing volatility in the stock price.
- Conclusion: The volatility indicators suggest a sideways movement or potential consolidation in the stock price.
Volume Analysis:
- On-Balance Volume (OBV): The OBV has been fluctuating but has not shown a clear trend, indicating indecision among investors.
- Chaikin Money Flow (CMF): The CMF has been positive but declining, suggesting a potential outflow of money from the stock.
- Conclusion: The volume indicators point towards uncertainty in investor sentiment.
Overall Conclusion:
Based on the analysis of the technical indicators: - Trend: The trend indicators are bullish. - Momentum: The momentum indicators are mixed with a slight bearish bias. - Volatility: The volatility indicators suggest sideways movement or consolidation. - Volume: The volume indicators indicate uncertainty among investors.
Final Verdict:
Considering the overall analysis, the next few days' possible stock price movement for EV stock is likely to be sideways or consolidation with a slight bearish bias. Investors should closely monitor the momentum indicators for any potential reversal in the bullish trend and be cautious of the uncertain volume dynamics.